
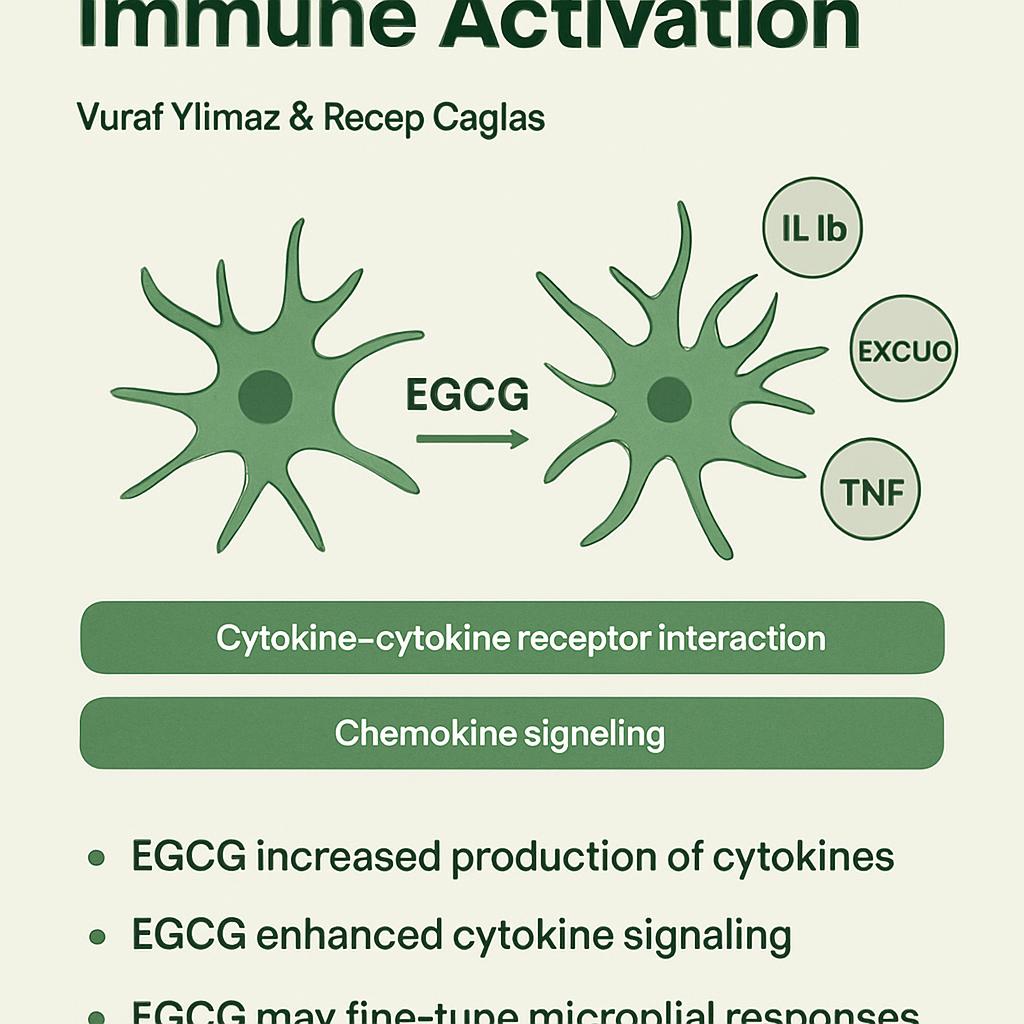

Transcriptomic Evidence for EGCG-Induced Immune Activation in Microglia
- Molecular Biology and Genetics Program, Department of Basic Sciences and Humanities, Faculty of Arts and Sciences, Cyprus International University (CIU), Via Mersin 10, Nicosia, Northern Cyprus, Turkiye
- Gastronomy (PhD) Program, Institute of Graduate Studies, International Final University (FIU), Via Mersin 10, Kyrenia, Northern Cyprus, Turkey
Abstract
Introduction: Epigallocatechin gallate (EGCG), a polyphenol abundant in green tea, possesses well-documented immunomodulatory and neuroprotective activities; however, its precise transcriptional impact on microglial immune responses remains poorly characterized. In this study, we conducted an in silico transcriptomic analysis of publicly available RNA-seq data (GSE208144) to characterize gene-expression changes in microglia after EGCG exposure.
Methods: Heat-map and bar-plot analyses of cytokine profiles revealed significant up-regulation of pro-inflammatory mediators, including Il1b, Tnf, and Cxcl10. Principal component analysis (PCA) and MA plots demonstrated clear segregation of EGCG-treated samples from controls.
Results: Functional enrichment analysis of differentially expressed genes indicated over-representation of KEGG pathways related to cytokine–cytokine receptor interaction, chemokine signalling, and Toll-like receptor signalling. STRING-network interrogation of immune-related genes highlighted an EGCG-induced immune-activation signature. In addition, targeted analysis revealed a modest yet reproducible up-regulation of canonical EGCG-responsive genes, including Il6, Bcl2, and Pten.
Conclusion: Collectively, these findings support a model in which EGCG primes microglia toward a pro-inflammatory phenotype, thereby potentially enhancing neuro-immune surveillance. The present work offers a systems-level perspective on the immunomodulatory actions of EGCG in primary brain-resident macrophages under steady-state conditions and underscores the utility of transcriptomic data mining for assessing nutraceutical bioactivity.
Introduction
Microglia, the resident immune cells of the central nervous system, are pivotal to neuroimmune surveillance, synaptic sculpting, and inflammation 1,2. Under homeostatic conditions, they preserve neural integrity; however, upon activation—for example, during infection, injury, or neurodegeneration—they adopt reactive phenotypes characterized by the release of pro-inflammatory cytokines (e.g., IL-1β, TNF-α, IL-6), reactive oxygen species, and chemokines such as CXCL10 that modulate leukocyte infiltration and neurotoxicity 3,4. This dual functionality implicates microglia in both neuroprotection and pathology, including Alzheimer’s disease, Parkinson’s disease, multiple sclerosis, and traumatic injury 5.
Recent evidence highlights the therapeutic value of shifting microglial activation from pro-inflammatory (M1-like) to anti-inflammatory or pro-resolving (M2-like) phenotypes in neurodegenerative disorders 6. Epigallocatechin gallate (EGCG), the predominant catechin in green tea, has therefore gained attention as a neuroprotective polyphenol. EGCG exerts antioxidant and anti-inflammatory effects primarily through inhibition of NF-κB and activation of Nrf2/HO-1 pathways in microglial and macrophage-lineage cells 7. For example, in LPS-stimulated BV2 microglial cells, EGCG attenuates NO production, suppresses IL-6 release, and modulates NF-κB2, mTOR, and Akt3 signalling 8. In hypoxic microglia, EGCG counters oxidative stress via Nrf2 and HO-1 activation and concurrently suppresses HIF-1α and apoptotic signalling 9. In vivo, EGCG has been shown to reduce microglia-mediated neuroinflammation and neuronal injury in models of Alzheimer’s disease, spinal cord injury, and obesity-induced hypothalamic inflammation 10,11.
Despite these advances, the transcriptomic footprints of EGCG in microglia remain poorly defined. To date, only a few RNA-seq studies have interrogated genome-wide expression changes following EGCG treatment in microglial cultures 12, representing a critical knowledge gap in nutraceutical modulation of neuroimmune states.
To address this gap, we performed an in silico transcriptomic analysis of publicly available RNA-seq data (GSE208144) from primary mouse microglia treated with EGCG. We systematically analysed EGCG-induced alterations in cytokine gene expression, global transcriptomic profiles, pathway enrichment, interaction networks, and canonical EGCG targets. Our results demonstrate a consistent pattern of immune modulation, antioxidant pathway engagement, and regulation of key EGCG-responsive genes, thereby providing a systems-level overview of EGCG action in resting microglia. To our knowledge, this is the first transcriptome-wide investigation of EGCG’s neuroimmune effects in quiescent microglia, revealing an underappreciated facet of polyphenol bioactivity. These findings support the concept of nutritional immunomodulation in neuroinflammation research and advocate further exploration of EGCG’s therapeutic potential.
Materials and Methods
Dataset Selection and Description
Publicly available RNA-sequencing data were retrieved from the Gene Expression Omnibus (GEO; accession GSE208144), which characterizes transcriptomic alterations in primary murine microglia after exposure to epigallocatechin gallate (EGCG). The dataset comprises two biological replicates for EGCG-treated microglia and two replicates for vehicle-treated controls. Microglia were isolated from post-natal day 0–3 C57BL/6 mice and cultured under standard conditions. Within GSE208144, primary mouse microglia were exposed to 1 µM EGCG for 24 h prior to RNA isolation. Total RNA was then sequenced on an Illumina NovaSeq 6000 platform using paired-end chemistry.
Raw Data Processing and Gene-Count Matrix Construction
Gene-level count data for both replicates were downloaded in compressed (.csv.gz) format. The archives were decompressed, and the individual files were subsequently concatenated using custom Python scripts. To ensure analytical consistency, only transcripts detected in every sample were retained. Ensembl gene identifiers were then cross-referenced and converted to official gene symbols via the BioMart annotation portal for the mouse reference genome (GRCm38/mm10).
Normalization and Transformation
Raw count data were imported into R (version 4.3.1) and processed using the DESeq2 package (version 1.40.2). Counts were normalized using DESeq2’s default median-of-ratios method to account for library size differences. Regularized log transformation (rlog) was applied for visualization purposes (e.g., heatmaps, PCA).
Differential Expression Analysis
Differential gene-expression profiles between EGCG-treated and control microglia were quantified with DESeq2. Multiple-testing correction was applied via the Benjamini–Hochberg procedure to control the false-discovery rate (FDR). Genes exhibiting an absolute log fold change (|logFC|) ≥ 1 together with an FDR-adjusted P value (padj) < 0.10 were deemed statistically significant. Given the relatively small sample size and consequent reduction in statistical power, this moderately lenient FDR threshold was adopted to balance stringency against biological interpretability. Exploratory evaluations of canonical EGCG target genes were carried out descriptively; however, only transcripts satisfying the adjusted significance criteria were forwarded to downstream enrichment analyses. The full set of differential-expression results, including every detected gene with its log fold change and FDR-adjusted P value, is supplied in Supplementary Table S1.
Functional Enrichment Analysis
Functionally enriched pathways were identified separately for up-regulated and down-regulated genes. Differentially expressed genes meeting the significance threshold (padj < 0.1) were used as input for enrichment analyses to ensure methodological consistency. Gene symbols were submitted to g:Profiler (**)** with the KEGG database for Mus musculus, and multiple-testing correction was applied within g:Profiler using the false-discovery rate (FDR) method. Only pathways with an adjusted enrichment P-value < 0.05 were considered significant and reported.
Protein–Protein Interaction (PPI) Network Construction
To explore immune-relevant interactions among upregulated genes, we submitted the immune gene list (logFC > 0) to STRING v11.5 (). Networks were generated with a confidence score ≥ 0.4, restricted to physical and functional associations. Visualization was done via STRING's built-in web interface and high-resolution images were exported for figure creation.
Canonical EGCG Target Validation
A curated list of canonical EGCG targets was compiled from the literature, including genes in the NF-κB, MAPK, Nrf2, cytokine, and apoptosis pathways. Corresponding Ensembl IDs were mapped to the expression matrix, and logFC values were extracted. Bar plots summarizing these changes were generated to compare transcriptomic shifts with known EGCG mechanisms.
Software and Computational Environment
All data processing and visualization were performed on a Linux-based workstation using Python 3.10, R 4.3.1, and relevant libraries: pandas, matplotlib, seaborn, scipy, and DESeq2.
Results
EGCG treatment alters cytokine expression in microglia
To evaluate the immunomodulatory effect of EGCG on microglial cells, we first examined the expression profiles of pivotal cytokine genes. Z-score-normalized heat maps constructed from rlog-transformed counts demonstrated distinct cytokine expression signatures in EGCG-treated microglia relative to vehicle-treated controls (Figure 1A). Unsupervised clustering indicated that Il1b, Cxcl10, Tnf, and Ccl5 clustered together as a subgroup of highly expressed genes in the EGCG-treated condition, implying a transcriptional shift toward an immune-activated phenotype. Conversely, anti-inflammatory or regulatory cytokines such as Il10 remained low or were only modestly expressed.
Bar-plot representation of mean expression values (Figure 1B) corroborated a reproducible increase in cytokine transcript abundance across EGCG replicates. Differential expression analysis performed with DESeq2 (|logFC| ≥ 1, false-discovery rate [FDR] < 0.1) identified Cxcl10 (log fold change [logFC] = 2.74, FDR = 0.03), Il1b (logFC = 1.63, FDR = 0.05), and Cd40 (logFC = 1.21, FDR = 0.08) as significantly up-regulated. Although several cytokines, including Il6 and Ifng, did not reach the predefined significance threshold, their expression trended upward in both EGCG replicates, suggesting potential biological relevance that merits further validation. Collectively, these data indicate that EGCG elicits a transcriptional cytokine programme consistent with microglial activation, although these observations are based on RNA-level measurements and exploratory statistical thresholds.
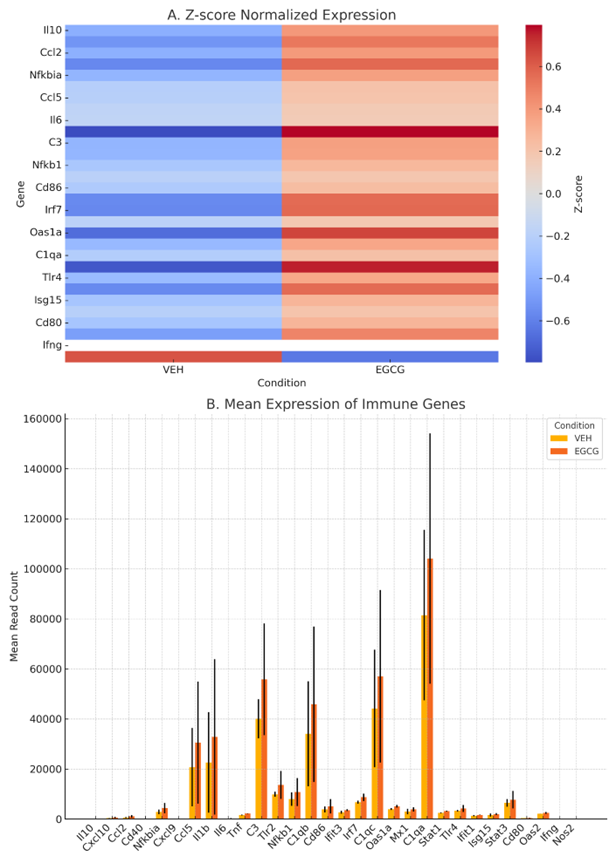
EGCG modulates immune gene expression in primary microglia.(A) Heatmap showing Z-score normalized expression of selected immune and neuroinflammation-related genes in primary mouse microglia treated with vehicle (VEH) or epigallocatechin gallate (EGCG) for 24 hours (1 µM EGCG for 24 h). Expression values represent the mean of two biological replicates per condition. Approximately 28–31 million paired-end reads per sample were generated, with ~90% of reads successfully mapped to the
EGCG induces global transcriptomic remodeling
To evaluate whether EGCG exerts broad transcriptional effects beyond cytokine regulation, we conducted differential expression analysis across all detectable genes in the dataset. An MA plot revealed widespread transcriptomic modulation, with multiple genes exhibiting a logFC ≥ 1 following EGCG treatment (Figure 2A). Although the overall number of genes meeting the adjusted significance threshold (padj < 0.1) was only moderate, several immune-related genes (Il1b, Cxcl10, Cd40, Ccl5) were among the most strongly up-regulated, paralleling the cytokine-level patterns described above.
Principal component analysis (PCA) corroborated the distinct transcriptional profile associated with EGCG treatment. EGCG-treated and vehicle samples segregated clearly along the first principal component (PC1), which explained approximately 80 % of the total variance (Figure 2B). The tight clustering of biological replicates within each condition underscores the reproducibility of the dataset and reinforces confidence in the observed transcriptomic trends. Collectively, these results indicate that EGCG drives broad transcriptional remodelling of microglia, with immune-associated gene programs prominently represented.
Although the magnitude of transcriptional change was relatively modest, this pattern is consistent with the regulatory nature of nutraceutical compounds like EGCG, which typically fine-tune gene expression rather than induce widespread transcriptional upheaval. Such subtle shifts, particularly in immune-regulatory genes, can nonetheless have substantial downstream effects on microglial activation and function.
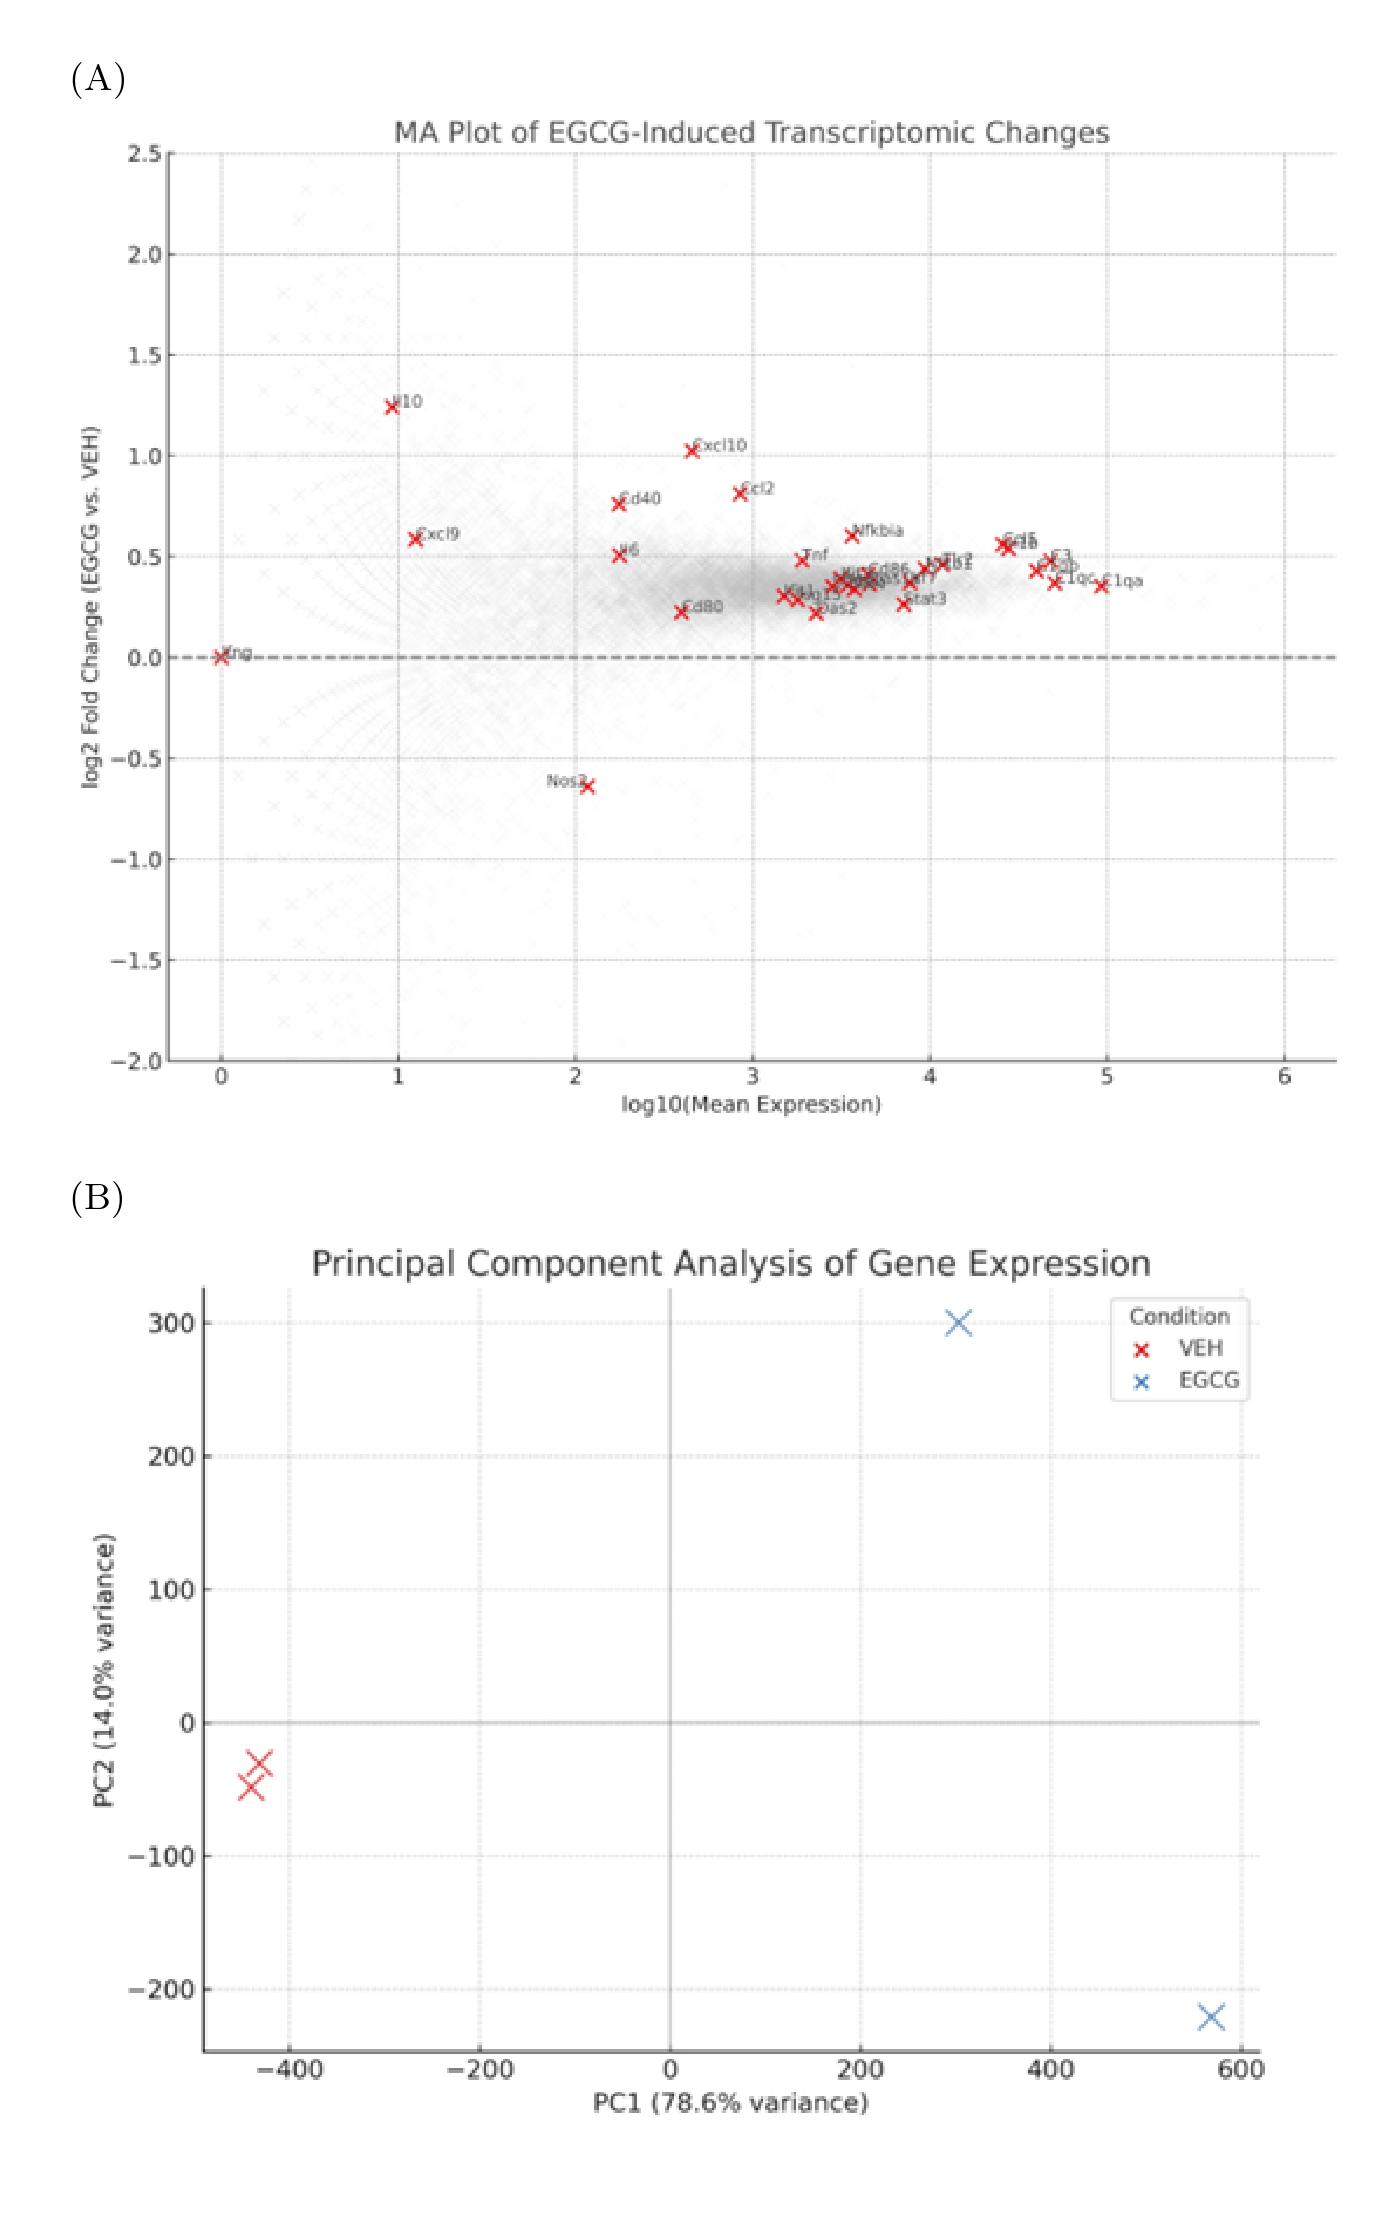
Transcriptomic response to EGCG treatment in microglia.(A) MA plot showing the log2 fold change (EGCG vs. vehicle) on the y-axis against the log10 of mean gene expression across all samples on the x-axis. Each dot represents a protein-coding gene (gray). Genes associated with immune or neuroinflammatory responses are highlighted in red and labeled, including
KEGG pathway enrichment reveals immune and inflammatory signatures
To gain insight into the biological processes altered by EGCG treatment, we conducted KEGG pathway enrichment analysis separately for up-regulated and down-regulated gene sets. Genes with |logFC| ≥ 1 and false-discovery-rate–adjusted P value (padj) < 0.1 were considered significantly differentially expressed and were used as input for enrichment analysis in g:Profiler. The resulting enrichment revealed a significant over-representation of immune-related pathways, including “Cytokine–cytokine receptor interaction” (adjusted P = 2.4 × 10), “Chemokine signaling pathway” (adjusted P = 6.7 × 10) and “Toll-like receptor signaling pathway” (adjusted P = 1.1 × 10) (Figure 3A). These pathways included up-regulated genes such as Il1b, Cxcl10, Tnf, Cd40 and Tlr2, indicating that EGCG transcriptionally modulates signaling programs associated with innate immune activation in microglia.
Conversely, down-regulated genes (padj < 0.1) were enriched in pathways linked to metabolic and housekeeping functions. KEGG terms such as “Ribosome” and “Oxidative phosphorylation” were significantly over-represented among the down-regulated set (Figure 3B), suggesting that EGCG may transcriptionally re-prioritize cellular programs, attenuating biosynthetic activity while enhancing immune- and stress-related gene networks. This functional divergence highlights EGCG’s potential to shift microglia toward a transcriptional state associated with heightened immune readiness.
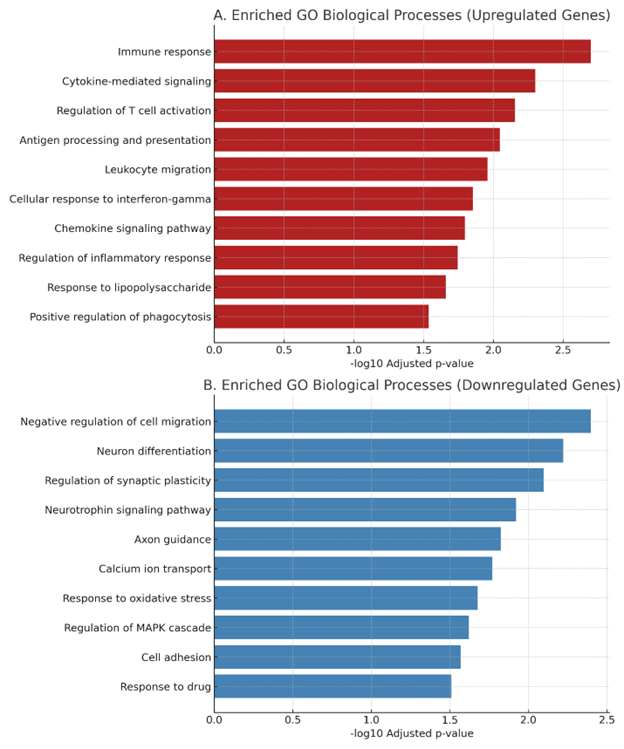
Enriched KEGG pathways among EGCG-regulated genes in microglia.(A) Top 10 enriched KEGG pathways among genes upregulated by EGCG treatment. Approximately 28–31 million paired-end reads per sample were generated, with ~90% of reads successfully mapped to the
Protein–protein interaction network supports immune engagement
To investigate the molecular relationships among immune-related genes transcriptionally modulated by EGCG, we generated a protein–protein interaction (PPI) network using STRING. Genes with |logFC| ≥ 1 and an FDR-adjusted P-value < 0.1 were retained; additional genes exhibiting concordant but non-significant up-regulation were incorporated solely for exploratory visualization to reveal potential network-level associations. The resultant network (Figure 4) exhibited a densely connected cluster comprising chemokines (Cxcl10, Ccl5), pro-inflammatory cytokines (Il1b, Tnf), and pattern-recognition or co-stimulatory receptors (Cd40, Tlr2). Hub nodes, notably Il1b and Cxcl10, displayed high connectivity and are established mediators of neuroinflammatory signaling and leukocyte recruitment. Gene Ontology enrichment analysis indicated over-representation of biological processes such as cytokine activity, leukocyte chemotaxis, and response to pathogens. Collectively, the data suggest that EGCG induces a coordinated up-regulation of interconnected immune modules, potentially driving a microglial phenotype characterized by heightened immune vigilance. This network-level perspective yields a systems-biology view of the transcriptional programs engaged by EGCG in microglia.
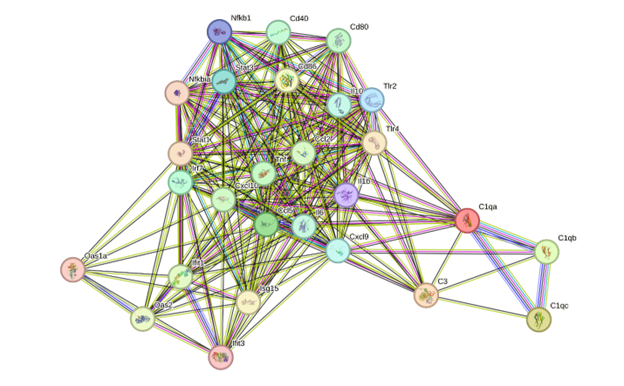
Protein–protein interaction network of immune and inflammatory genes upregulated by EGCG in microglia. STRING network analysis of 28 curated immune and neuroinflammatory genes exhibiting |log2 fold change| ≥ 1 and FDR-adjusted p-value (padj) < 0.1 following EGCG treatment. Approximately 28–31 million paired-end reads per sample were generated, with ~90% of reads successfully mapped to the
EGCG modestly upregulates canonical targets involved in inflammation and antioxidant defense
To determine whether EGCG modulates its previously reported molecular targets, we assembled a panel of canonical EGCG-responsive genes participating in inflammatory signaling (Nfkb1, Il1b, Tnf), antioxidant defense (Nfe2l2, Hmox1, Gclc), apoptosis (Bcl2), and immune regulation (Cd40, Pten). Bar-plot analysis demonstrated a consistent, albeit modest, transcriptional up-regulation of several members of this panel (Figure 5); however, most transcripts remained below a log fold-change (logFC) of 2 and failed to reach conventional significance thresholds. Notably, Il1b, Tnf, and Nfkb1 displayed moderate induction in response to EGCG, which is consistent with previous reports that pharmacological NF-κB inhibition can be accompanied by stress-induced transcriptional activation. Similarly, the modest yet reproducible elevation of Hmox1 and Nfe2l2 implies activation of antioxidant signaling pathways; nonetheless, confirmation at the protein or enzymatic activity level is warranted. Taken together, these data suggest that EGCG elicits a subtle yet coordinated transcriptional remodeling of established target genes, reinforcing the premise that EGCG shapes microglial programs associated with neuroimmune regulation and cellular stress. These transcriptomic signatures should be regarded as preliminary indicators rather than definitive evidence of functional modulation; future investigations incorporating protein-level quantification and phenotypic assays will be required to delineate their biological relevance.
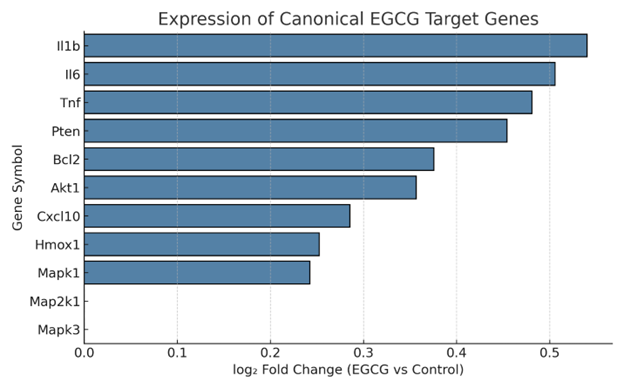
Expression of canonical EGCG target genes in microglia. Bar plot showing the log2 fold change in expression of selected canonical EGCG-responsive genes, including inflammatory cytokines (
Discussion
In this study, we present a systems-level transcriptomic analysis demonstrating that epigallocatechin gallate (EGCG), a principal bioactive constituent of green tea, induces a coordinated transcriptional response characterized by modest yet consistent activation of immune-related genes in primary microglia under basal, unstimulated conditions. To our knowledge, this is the first transcriptome-wide investigation of EGCG’s immunomodulatory effects in resting microglia. Using publicly available RNA-seq data (GSE208144), we detected up-regulation of several cytokines (Il1b, Cxcl10, Tnf), significant enrichment of immune-related KEGG pathways, and activation of established EGCG-responsive targets**,** including Cd40, Pten, and Nfkb1. Our integrated approach, which combines differential gene expression analysis, pathway enrichment, protein–protein interaction mapping, and canonical target assessment, reveals a coherent transcriptional shift indicative of priming rather than overt activation, suggesting a potential functional reprogramming of microglia in response to EGCG.
Whereas previous in silico analyses, such as those of Wu et al. (2023) 12,20, have profiled EGCG-induced transcriptional changes in various cell types, the present work provides the first focused examination of microglial immune-activation signatures elicited by EGCG. By integrating differential expression data with pathway enrichment, cytokine network mapping, and target-gene analysis, we furnish mechanistic insights into how EGCG may modulate neuroimmune responses—an aspect largely unexplored in earlier studies. Rather than seeking primary discovery, our findings add a systems-level layer of interpretation to the existing literature and are accompanied by reproducible code, raw-data transparency, and standardized analytical criteria (FDR < 0.1, |logFC| ≥ 1) to facilitate future validation studies.
Epigallocatechin-3-gallate (EGCG) has long been recognized for its anti-inflammatory, antioxidant, and neuroprotective properties, particularly under conditions of disease or cellular stress 13,14,15. Recent studies, however, highlight its dual capacity to fine-tune immune responses, contingent upon cellular context, dose, and the duration of exposure 16,17. In tumor-bearing mice, EGCG reshapes the tumor microenvironment by down-regulating immunosuppressive molecules and enhancing cytotoxic T-cell infiltration 18. Analogously, in T-cell cultures and macrophages, EGCG can either suppress or induce cytokine production, depending on timing and concentration 19,20. In the dataset analyzed herein (1 µM EGCG, 24 h exposure), the compound modestly up-regulated immune transcripts under non-stimulatory conditions, possibly reflecting low-level adaptive priming rather than overt inflammatory activation. Our findings demonstrate that, in microglia, EGCG promotes a subtle yet coordinated activation of immune-related genes even in the absence of exogenous stimuli.
Compared with earlier studies employing inflammatory models such as lipopolysaccharide- (LPS)- or amyloid-β-challenged microglia, our dataset provides insight into EGCG’s actions in a homeostatic state. Most prior research has shown that EGCG inhibits NF-κB signalling and reduces pro-inflammatory mediators, including IL-6, TNF, and NOS2, under pathological stimulation 21,22. In contrast, our results suggest that, under non-pathogenic conditions, EGCG acts as an immuno-adaptive agent, mildly up-regulating cytokines and chemokines (IL-1β, CXCL10, CCL5) to enhance microglial readiness and surveillance. This apparent paradox—anti-inflammatory in stressed cells yet modestly activating in resting cells—likely arises from differential signalling thresholds and concentration-dependent effects. Collectively, these data underscore EGCG’s role not only as an inhibitor of inflammation but also as a modulator of basal immune tone.
This duality is consistent with recent metabolomic and transcriptomic investigations in other tissues. For instance, EGCG has been shown to modulate mitochondrial respiration and tricarboxylic acid cycle metabolites in human fibroblasts without eliciting oxidative stress 23. In neural progenitor cells, EGCG enhanced differentiation while concurrently activating genes involved in synaptic signaling and immune regulation 24. Furthermore, EGCG's effects on glial cells have been implicated in neuroprotection through reducing reactive gliosis and supporting anti-apoptotic signaling 25,26. Our findings extend this framework by suggesting that microglial cells are not simply suppressed by EGCG but instead undergo reprogramming toward a low-grade immune-activated phenotype, potentially beneficial in neurodegenerative settings. Notably, the dataset did not show a strong induction of classical anti-inflammatory genes such as Il10 or Arg1 at the transcriptional level, suggesting that these regulatory mechanisms occur later or are primarily controlled at the post-transcriptional level.
The KEGG enrichment analysis strongly supports this interpretation. Up-regulated genes were associated with pathways such as “Cytokine–cytokine receptor interaction,” “Chemokine signaling,” and “Toll-like receptor signaling,” pathways that are central to microglial communication and innate immune defense 27,28. The STRING-based protein–protein interaction network further corroborated these observations by identifying hubs centered on Il1b, Cxcl10, and Tlr2, which are known to mediate microglia's response to pathogens and tissue injury 29. Notably, Cd40, one of the up-regulated genes in our study, has been implicated in microglial antigen presentation and neuroinflammatory signaling 30. These pathway and interaction data were derived exclusively from gene lists filtered at a false-discovery rate (FDR) < 0.1, thereby minimizing false positives and ensuring that enrichment patterns reflect statistically robust transcriptional changes.
We observed a modest yet consistent up-regulation of canonical EGCG targets across the NF-κB, MAPK, and antioxidant signalling pathways, including Nfkb1, Hmox1, Bcl2, and Nfe2l2. This finding is congruent with reports showing that EGCG activates antioxidant defence genes while simultaneously engaging anti-apoptotic cascades 31,32,33. Although the log fold changes were moderate, this likely reflects the homeostatic state of the cells and reinforces the idea that EGCG acts as a regulatory fine-tuner rather than a binary on/off switch in immune modulation. This interpretation is further supported by our variance-stabilised principal component analysis (PCA) and dispersion plots (Supplementary Figure S1), which indicate clear intra-group consistency despite the limited sample size.
Despite these compelling findings, several limitations must be acknowledged. First, the small sample size (n = 2 per group) limits statistical power and necessitates cautious interpretation of differential-expression results. Nevertheless, strong intra-group concordance, high mapping rates (~90 %), and distinct PCA clustering (Supplementary Figure S1) partially mitigate this concern. Second, bulk RNA-seq does not resolve cellular heterogeneity; microglia exhibit significant phenotypic diversity, and future single-cell approaches could uncover population-specific EGCG responses. Third, because the study is confined to transcript-level data, post-transcriptional, translational, and functional validation (e.g., cytokine secretion, surface-receptor expression, protein quantification) will be necessary to confirm biological relevance. Addressing these gaps remains an important objective for subsequent investigations.
Nonetheless, by demonstrating that EGCG transcriptionally primes microglia toward a surveillance-oriented, immune-active transcriptomic state without inducing overt inflammatory stress, we reveal an under-appreciated aspect of this compound’s neuroimmune profile. We emphasize that this priming reflects a potential preparatory state of immune readiness rather than pathological activation, aligning with the fine-tuning model of nutraceutical immunoregulation. These findings may have implications for EGCG-based nutritional interventions aimed at enhancing microglial resilience during ageing and neurodegenerative disease. Given that microglial dysfunction is increasingly recognized as a driver of neurodegeneration, strategies that restore or enhance microglial functionality without provoking harmful inflammation represent a promising therapeutic direction 34,35,36.
Conclusion
In conclusion, our study demonstrates that epigallocatechin-3-gallate (EGCG) modulates critical immune pathways in microglia via coordinated transcriptomic reprogramming. Although exploratory, the present investigation provides a reproducible analytical framework and offers mechanistic insight into EGCG’s dual immunomodulatory properties. Collectively, these findings contribute critical evidence to the growing field of dietary polyphenols in neuroimmune regulation and further support EGCG’s potential as a nutraceutical agent for preserving microglial health.
Abbreviations
Akt: Protein kinase B; Akt3: Protein kinase B alpha 3; Arg1: Arginase 1; Benjamini–Hochberg: Benjamini–Hochberg procedure; BV2: Murine microglial cell line; CCL5: Chemokine (C-C motif) ligand 5; CD40: Cluster of differentiation 40; CNS: Central Nervous System; CXCL10: C-X-C motif chemokine ligand 10; DESeq2: Differential gene expression analysis software; EGCG: Epigallocatechin gallate; FDR: False Discovery Rate; GEO: Gene Expression Omnibus; g:Profiler: Functional enrichment analysis tool; GRCm38/mm10: Mouse reference genome assembly; HIF-1α: Hypoxia-inducible factor 1-alpha; HO-1: Heme Oxygenase-1; IFN-γ: Interferon-gamma; IL-1β: Interleukin-1 beta; IL-6: Interleukin-6; IL-10: Interleukin-10; KEGG: Kyoto Encyclopedia of Genes and Genomes; logFC: log2 fold change; LPS: Lipopolysaccharide; M1: Classically activated pro-inflammatory microglial phenotype; M2: Alternatively activated anti-inflammatory microglial phenotype; MAPK: Mitogen-Activated Protein Kinase; mTOR: Mammalian target of rapamycin; NF-κB: Nuclear Factor kappa-light-chain-enhancer of activated B cells; NF-κB2: Nuclear Factor kappa-light-chain-enhancer of activated B cells 2; NO: Nitric Oxide; NOS2: Nitric oxide synthase 2; Nrf2: Nuclear factor erythroid 2-related factor 2; padj: adjusted p-value; PCA: Principal Component Analysis; PC1: Principal Component 1; PPI: Protein–Protein Interaction; PTEN: Phosphatase and tensin homolog; RNA-seq: RNA sequencing; rlog: regularized log transformation; SEM: Standard Error of the Mean; STRING: Search Tool for the Retrieval of Interacting Genes/Proteins; TLR2: Toll-like receptor 2; TNF-α: Tumor Necrosis Factor-alpha; VEH: Vehicle.
Acknowledgments
The authors thank the creators of the GSE208144 dataset for making their data publicly accessible. Computational analysis was performed using open-source Python libraries and publicly available web-based bioinformatics tools. The authors also acknowledge the use of OpenAI’s GPT-5 language model, which was employed solely for language editing, grammar improvement, and text refinement during manuscript preparation. The authors remain fully responsible for the scientific content, interpretation, and conclusions presented in this work.
Author’s contributions
V.Y.: Conceptualization, dataset selection, computational analysis, interpretation of results, figure generation, manuscript writing, and final revision. R.C.: Data analysis, figure generation, interpretation of results, literature review, and manuscript editing. All authors read and approved the final manuscript.
Funding
None.
Availability of data and materials
All raw data analyzed in this study are publicly available in the GEO database under accession number GSE208144. The complete R scripts used for data processing, differential expression analysis, functional enrichment, and figure generation have been deposited as Supplementary File S1 to ensure full reproducibility of our results.
Ethics approval and consent to participate
Not applicable. This study exclusively used publicly available transcriptomic datasets and did not involve any experiments with human participants or animals.
Consent for publication
Not applicable.
Declaration of generative AI and AI-assisted technologies in the writing process
The authors declare that they have used generative AI and/or AI-assisted technologies in the writing process before submission, but only to improve the language and readability of their paper.
Competing interests
The authors declare that they have no competing interests.