

L-Carnitine and α-Tocopherol as Potential Modulators of Oxidative Stress in Cyclophosphamide-Treated Erythrocytes: An Ex Vivo Study
- Department of Biotechnology & Genetics, School of Sciences, JAIN (Deemed-to-be University), #34, 1st Cross, JC Road, Sampangi Rama Nagar, Bengaluru, Karnataka 560027, India
Abstract
Introduction: Oxidative stress (OS) compromises erythrocyte structural and functional properties and alters membrane permeability, ultimately resulting in hemolysis. Cyclophosphamide (CYP) is a widely used chemotherapeutic agent frequently implicated in OS due to the generation of cytotoxic reactive metabolites. Although CYP therapy is clinically associated with anemia, its direct effects on erythrocyte redox homeostasis remain underreported. Antioxidants mitigate cellular damage by scavenging reactive oxygen species (ROS). Both α-tocopherol (TO) and L-carnitine (LC) have demonstrated efficacy in attenuating erythrocyte OS through their free radical-scavenging and membrane-stabilizing activities. Therefore, this study investigated the dose-dependent effects of CYP and its interactions with LC and TO using rat erythrocytes as an ex vivo model of OS.
Methods: Erythrocytes isolated from male Wistar rats were divided into two experimental sets and treated with CYP at concentrations of 0.2 mM (CYP1), 0.4 mM (CYP2), or 0.8 mM (CYP3) alone or following pre-incubation with either 10 mM LC or 2 mM TO. Erythrocyte integrity markers (hemoglobin and hemolysis), enzymatic and non-enzymatic antioxidant defenses, reactive oxygen and nitrogen species, lipid peroxidation, protein oxidation, and metabolic markers were systematically evaluated.
Results: Exposure to CYP increased ROS generation, depleting endogenous antioxidant defenses and inducing marked OS. In the CYP-treated groups, hemoglobin (Hb), total antioxidant capacity (TAC), protein sulfhydryls (P-SH), and catalase (CAT) activity decreased significantly, whereas hemolysis, superoxide dismutase (SOD) activity, and reduced glutathione (GSH) levels increased. Pre-treatment with LC elevated SOD, CAT, GSH, P-SH (at 0.4 mM CYP), malondialdehyde (MDA), and hemolysis, whereas Hb and TAC remained lower than control levels in the CYP+LC groups. Thus, although LC upregulated specific endogenous antioxidant defenses in response to CYP-induced OS, it did not fully prevent membrane damage or restore TAC. Conversely, pre-treatment with TO significantly enhanced TAC, preserved Hb levels, and attenuated hemolysis at high CYP concentrations, thereby maintaining erythrocyte membrane integrity, although MDA levels remained elevated in the CYP2+TO group.
Conclusion: α-Tocopherol attenuated hemolysis and enhanced total antioxidant defenses more effectively than L-carnitine during CYP-induced OS in rat erythrocytes. These findings elucidate the distinct modulatory interactions between erythrocytes and exogenous antioxidants (TO and LC) and establish isolated erythrocytes as a responsive ex vivo model for evaluating drug-induced oxidative stress.
Graphical abstract
INTRODUCTION
Erythrocytes are continuously exposed to a highly oxidizing environment owing to their primary physiological role in oxygen transport. Oxidative stress (OS) alters erythrocyte membrane permeability and viscoelasticity, culminating in premature cell lysis (hemolysis). Excessive generation of reactive oxygen species (ROS) disrupts cellular redox homeostasis in both healthy and neoplastic cells, resulting in lipid peroxidation, protein modification, and enzyme inactivation. Although erythrocytes possess specialized enzymatic and non-enzymatic antioxidant defense systems to counteract oxidative insults, exposure to endogenous metabolites, chemotherapeutic drugs, and exogenous oxidants can overwhelm these defenses1. Recent studies emphasize that erythrocytes serve as a sensitive cellular model of OS, exhibiting not only lipid peroxidation but also protein oxidation, cytoskeletal remodeling, and hemolysis during ROS-mediated redox imbalance2.
Cyclophosphamide (CYP) is a broad-spectrum alkylating chemotherapeutic and immunosuppressive agent widely prescribed for the management of malignant neoplasms and autoimmune disorders. Chloroacetaldehyde, a cytotoxic byproduct formed during the in vitro aqueous oxidation and metabolic activation of CYP, generates reactive intermediates that deplete cellular thiols3. Furthermore, CYP metabolism yields highly reactive carbonium ions, phosphoramide mustard, and acrolein, which attack electron-rich nucleophilic sites within membrane lipids and intracellular proteins, thereby compromising membrane integrity and triggering eryptosis-like changes that lead to hemolysis4,5. Despite well-documented clinical associations between CYP administration and hematological toxicity, the mechanistic basis of direct CYP-induced alterations in erythrocyte redox homeostasis remains incompletely characterized. Consequently, three concentrations of CYP (0.2, 0.4, and 0.8 mM) were examined in the present study to evaluate its dose-dependent impact on isolated erythrocytes.
Adjunctive antioxidant therapies have garnered considerable interest in mitigating chemotherapy-induced toxicity because they quench free radical chain reactions and prevent or delay oxidative cellular injury. L-Carnitine (LC) and α-tocopherol (TO; vitamin E) are well-characterized compounds known to modulate erythrocyte survival and function. Previous investigations have demonstrated that 10 mM LC and 2 mM TO effectively attenuate storage-induced oxidative lesions in banked erythrocytes6,7,8. Physiologically, LC facilitates the mitochondrial β-oxidation of long-chain fatty acids, while carnitine and its acyl esters present within erythrocytes contribute to membrane phospholipid turnover and cytoskeletal stability6. Similarly, TO acts as a potent lipophilic chain-breaking antioxidant that inhibits lipid peroxidation and preserves membrane architecture9. However, the comparative modulatory effects of LC and TO against direct CYP-induced oxidative injury in erythrocytes remain unexplored. Therefore, this ex vivo study investigated the dose-dependent oxidative effects of CYP on rat erythrocytes and evaluated the protective efficacy of LC and TO supplementation during CYP-induced OS.
MATERIALS AND METHODS
Animal Procurement and Maintenance
Healthy male Wistar rats (4 months old; body weight: 180–200 g) were procured from Bioally Animal Facility and Research Pvt. Ltd., Bengaluru, India (Registration No. 1810/PO/RcBiBt/S/15/CCSEA). The animals were acclimatized to standard laboratory vivarium conditions for 1 week prior to experimentation. Rats were housed in polypropylene cages (five animals per cage) maintained at 28 ± 1 °C under a regulated 12 h light/12 h dark photoperiod, with ad libitum access to standard laboratory rodent chow and tap water. Animal care and handling complied with the guidelines of the Committee for the Purpose of Control and Supervision of Experiments on Animals (CCSEA). All experimental protocols were reviewed and approved by the Institutional Animal Ethics Committee of Nargund College of Pharmacy, Bengaluru, India (Approval No. IAEC/NCP/133/2023).
Chemicals and Reagents
Vitamin E (α-tocopherol) was purchased from Sigma-Aldrich Chemicals (St. Louis, MO, USA). L-Carnitine, epinephrine, 5,5′-dithiobis-(2-nitrobenzoic acid) (DTNB), bathocuproinedisulfonic acid disodium salt hydrate (BCS), Griess reagent, and bovine serum albumin (BSA) were obtained from HiMedia Laboratories (Mumbai, India). Cyclophosphamide injection IP (Cycloxan, 500 mg) was procured from a licensed pharmacy, and the Hemocor-D hemoglobin estimation kit was purchased from Coral Clinical Systems (Goa, India). Cytochrome c and reduced nicotinamide adenine dinucleotide phosphate (NADPH) were obtained from Sisco Research Laboratories Pvt. Ltd. (Mumbai, India). All other reagents were of analytical grade, and organic solvents were of spectrophotometric grade.
Blood Collection
Prior to blood collection, male Wistar rats were anesthetized via intraperitoneal administration of ketamine hydrochloride to ensure sedation. Whole blood (5 mL) was collected via cardiac puncture with the animal positioned in dorsal recumbency and immediately transferred into collection tubes containing citrate-phosphate-dextrose-adenine (CPDA-1) anticoagulant. Following blood collection, animals were humanely euthanized by anesthetic overdose in accordance with institutional ethical guidelines. Blood samples were transported on ice and processed immediately for analysis10.
Experimental Design
Isolated erythrocytes were divided into two independent experimental sets—Set 1 evaluating L-carnitine (LC; n = 7) and Set 2 evaluating α-tocopherol (TO; n = 6)—and subjected to the treatment regimens detailed in Table 1.
Experimental design and treatment regimens for evaluating the effects of L-carnitine and α-tocopherol on cyclophosphamide-treated rat erythrocytes
| Table 1A. Experimental Set 1: L-Carnitine (LC) Treatment Groups ( | ||
|---|---|---|
| Experimental Set | Group Code | Treatment Regimen |
| Set 1 (n = 7) | Control | Untreated erythrocytes incubated in isotonic phosphate buffer (10 mM, pH 7.4) |
| Set 1 (n = 7) | CYP1 | Erythrocytes incubated with 0.2 mM CYP for 1 h at 37 °C |
| Set 1 (n = 7) | CYP2 | Erythrocytes incubated with 0.4 mM CYP for 1 h at 37 °C |
| Set 1 (n = 7) | CYP3 | Erythrocytes incubated with 0.8 mM CYP for 1 h at 37 °C |
| Set 1 (n = 7) | LC | Erythrocytes incubated with 10 mM LC for 2 h at 37 °C |
| Set 1 (n = 7) | CYP1+LC | Erythrocytes pre-incubated with 10 mM LC (2 h, 37 °C) followed by 0.2 mM CYP (1 h, 37 °C) |
| Set 1 (n = 7) | CYP2+LC | Erythrocytes pre-incubated with 10 mM LC (2 h, 37 °C) followed by 0.4 mM CYP (1 h, 37 °C) |
| Set 1 (n = 7) | CYP3+LC | Erythrocytes pre-incubated with 10 mM LC (2 h, 37 °C) followed by 0.8 mM CYP (1 h, 37 °C) |
| Table 1B. Experimental Set 2: α-Tocopherol (TO) Treatment Groups ( | ||
| Experimental Set | Group Code | Treatment Regimen |
| Set 2 (n = 6) | Control | Untreated erythrocytes incubated in isotonic phosphate buffer (10 mM, pH 7.4) |
| Set 2 (n = 6) | CYP1 | Erythrocytes incubated with 0.2 mM CYP for 1 h at 37 °C |
| Set 2 (n = 6) | CYP2 | Erythrocytes incubated with 0.4 mM CYP for 1 h at 37 °C |
| Set 2 (n = 6) | CYP3 | Erythrocytes incubated with 0.8 mM CYP for 1 h at 37 °C |
| Set 2 (n = 6) | TO | Erythrocytes incubated with 2 mM TO for 2 h at 37 °C |
| Set 2 (n = 6) | CYP1+TO | Erythrocytes pre-incubated with 2 mM TO (2 h, 37 °C) followed by 0.2 mM CYP (1 h, 37 °C) |
| Set 2 (n = 6) | CYP2+TO | Erythrocytes pre-incubated with 2 mM TO (2 h, 37 °C) followed by 0.4 mM CYP (1 h, 37 °C) |
| Set 2 (n = 6) | CYP3+TO | Erythrocytes pre-incubated with 2 mM TO (2 h, 37 °C) followed by 0.8 mM CYP (1 h, 37 °C) |
Erythrocyte Isolation
Whole blood was centrifuged at 1000 × g for 20 min at 4 °C. The supernatant plasma and buffy coat layer were carefully aspirated and discarded. The resulting erythrocyte pellet was washed three times with isotonic phosphate buffer (PB; 10 mM, pH 7.4) and resuspended in isotonic PB to yield a final hematocrit of 50% (v/v).
Erythrocyte Treatment Protocol
Stock and working solutions of CYP (final concentrations: 0.2, 0.4, and 0.8 mM), LC (10 mM), and TO (2 mM) were freshly prepared in 10 mM PB (pH 7.4). Erythrocyte suspensions were allocated into experimental groups as outlined in Table 1. For the CYP-only groups (CYP1, CYP2, and CYP3), erythrocytes were incubated with the respective CYP concentrations for 1 h at 37 °C. For the antioxidant-only groups (LC and TO), erythrocytes were incubated with 10 mM LC or 2 mM TO for 2 h at 37 °C. For the combination treatment groups (CYP+LC and CYP+TO), packed erythrocytes were first pre-incubated with the respective antioxidant solution (10 mM LC or 2 mM TO) for 2 h at 37 °C, pelleted by centrifugation, and subsequently exposed to the designated CYP concentration (0.2, 0.4, or 0.8 mM) for 1 h at 37 °C. Following incubation, erythrocytes from all experimental groups were pelleted, washed three times with isotonic PB to remove residual drug or antioxidant, resuspended in isotonic PB to a 50% (v/v) hematocrit, and assayed for erythrocyte integrity and oxidative stress biomarkers.
Assessment of Erythrocyte Markers
Hemoglobin (Hb)
Hemoglobin concentration in the erythrocyte suspension was quantified using the cyanmethemoglobin method as described by Dodge et al.11 with the commercial Hemocor-D reagent kit. Briefly, erythrocyte suspensions were incubated with Hemocor-D reagent at room temperature for 3 min, and absorbance was recorded spectrophotometrically at 540 nm.
Hemolysis
Susceptibility to oxidative hemolysis was determined in a 5% (v/v) erythrocyte suspension according to the method of Rajashekharaiah et al.10 Equal volumes of the 5% erythrocyte suspension and 1% hydrogen peroxide (H₂O₂) were mixed and incubated at 37 °C for 1 h. Following centrifugation, the hemoglobin released into the supernatant was measured spectrophotometrically at 540 nm and expressed as a percentage of total hemolysis.
Preparation of Hemolysates
Washed erythrocyte suspensions were lysed by adding hypotonic phosphate buffer (20 mOsm/L, pH 7.4). The resulting hemolysates were aliquoted and stored at −20 °C until biochemical analysis6.
Determination of Antioxidant Defense Markers
Superoxide Dismutase (SOD)
Superoxide dismutase activity was assayed according to the method of Misra and Fridovich12. Hemolysate samples diluted in carbonate buffer (0.05 M, pH 10.2) were mixed with acidified epinephrine solution (pH 2.0), and the rate of inhibition of epinephrine autoxidation was monitored spectrophotometrically at 480 nm.
Catalase (CAT)
Catalase activity was determined by the method of Aebi13. Hemolysate samples were pre-treated with absolute ethanol and incubated for 30 min at 0 °C to decompose inactive catalase Complex II. Subsequently, 6.6 mM H₂O₂ in phosphate buffer (pH 7.0) was added to initiate the reaction, and the decrease in absorbance was recorded over 1 min at 240 nm.
Reduced Glutathione (GSH)
Reduced glutathione content was quantified according to the method of Beutler14. Hemolysate proteins were precipitated with 4% sulfosalicylic acid, and the mixture was centrifuged at 2500 × g for 10 min. The clear supernatant was reacted with Ellman's reagent containing 10 mM DTNB in phosphate buffer, and the absorbance of the resulting yellow 5-thio-2-nitrobenzoate anion was measured at 412 nm.
Cupric Ion-Reducing Antioxidant Capacity–Bathocuproinedisulfonic Acid (CUPRAC-BCS) Assay
Total antioxidant capacity (TAC) was evaluated via the cupric ion-reducing antioxidant capacity assay using bathocuproinedisulfonic acid (CUPRAC-BCS) as described by Soumya and Vani15, utilizing uric acid as the calibration standard. Hemolysate samples were mixed with 0.25 mM BCS prepared in 10 mM PB (pH 7.4), and initial baseline absorbance was recorded at 490 nm. Copper(II) sulfate (0.5 mM) was then added, and the reaction mixture was incubated for 3 min at room temperature before adding 0.01 M ethylenediaminetetraacetic acid disodium salt (EDTA) to terminate the reaction. Final absorbance was measured at 490 nm.
Determination of Oxidative Stress and Metabolic Markers
Superoxide Radicals
Superoxide anion radical generation was quantified based on the superoxide-dependent reduction of ferricytochrome c according to Olas and Wachowicz16. Hemolysate samples were incubated with 160 µM cytochrome c at 37 °C, and absorbance was read spectrophotometrically at 550 nm. Superoxide concentrations were calculated using a molar extinction coefficient of 18,700 M⁻¹cm⁻¹ and normalized to total protein content.
Nitrites
Nitrite levels, serving as an index of nitric oxide and reactive nitrogen species (RNS) production, were measured using the colorimetric Griess reaction17. Hemolysate samples were mixed with Griess reagent consisting of 1% sulfanilamide and 0.1% N-(1-naphthyl)ethylenediamine dihydrochloride in 2.5% phosphoric acid (H₃PO₄). After incubation for 30 min in the dark at room temperature, absorbance was recorded at 546 nm.
Advanced Oxidation Protein Products (AOPP)
Advanced oxidation protein products were assayed spectrophotometrically according to Witko-Sarsat et al.18 Hemolysate samples were reacted with 1.16 M potassium iodide (KI) followed by glacial acetic acid, and the absorbance of the reaction mixture was read immediately at 340 nm. Concentrations of AOPP were calculated using an extinction coefficient of 26 mM⁻¹cm⁻¹.
Protein Sulfhydryls (P-SH)
Protein sulfhydryl groups in the hemolysates were measured according to the method of Habeeb19. Hemolysate aliquots were solubilized in 0.08 M sodium phosphate buffer (pH 8.0) containing 0.5 mg/mL EDTA and 2% sodium dodecyl sulfate (SDS). Following the addition of DTNB (2 mg/mL), the mixture was vortexed and incubated at room temperature to allow chromophore development. Absorbance was measured at 412 nm, and P-SH concentrations were calculated using a molar extinction coefficient of 13,600 M⁻¹cm⁻¹.
Malondialdehyde (MDA)
Lipid peroxidation was assessed by quantifying malondialdehyde (MDA) as thiobarbituric acid-reactive substances according to Ohkawa et al.20 Hemolysate samples were mixed with 8% SDS, vortexed, and incubated for 10 min at room temperature. Subsequently, 20% acetic acid (pH 3.5) and 0.6% aqueous thiobarbituric acid solution were added, and the tubes were heated in a boiling water bath (95–100 °C) until a pale yellow-to-pink chromogen developed. After cooling to room temperature, the chromogen was extracted into a n-butanol–pyridine (15:1, v/v) organic phase, centrifuged at 1000 × g for 5 min, and the absorbance of the upper organic layer was measured at 532 nm.
Lactate Dehydrogenase (LDH)
Lactate dehydrogenase activity was determined spectrophotometrically according to Buhl et al.21 Hemolysate samples were mixed with the working LDH reagent comprising Reagent 1 (80 mM Tris buffer, 1.6 mM pyruvate, and 200 mM NaCl) and Reagent 2 (0.2 mM NADH) combined in a 4:1 volume ratio. The reaction mixture was incubated at 37 °C for 3 min, and the rate of NADH oxidation was monitored at 340 nm.
Total Protein Estimation
Total protein content in the hemolysates was determined according to the method of Lowry et al.22 using BSA as the reference standard.
Statistical Analysis
All quantitative data are expressed as mean ± standard error of the mean (SEM) (n = 7 for Experimental Set 1 [L-carnitine]; n = 6 for Experimental Set 2 [α-tocopherol]). Intergroup comparisons within each experimental set were analyzed independently using one-way analysis of variance (ANOVA) followed by Tukey's post-hoc multiple comparison test in GraphPad Prism software (version 8.0; GraphPad Software, San Diego, CA, USA). Differences were considered statistically significant at P < 0.05.
RESULTS
All experimental values are presented as mean ± SEM (n = 7 for erythrocytes treated with CYP and LC; n = 6 for erythrocytes treated with CYP and TO). Statistical significance was set at P < 0.05, where * denotes a significant difference compared with the untreated Control group, # denotes a significant difference compared with the corresponding CYP-only group, and $ denotes a significant difference compared with the respective antioxidant-only (LC or TO) group. For clarity, findings for the LC (Set 1) and TO (Set 2) experimental sets are described in separate paragraphs under each biomarker subsection.
Hemoglobin (Hb)
In the LC experimental set, Hb concentration decreased significantly by 34% (P < 0.0001) in CYP2, 67% (P < 0.0001) in CYP3, and 38% (P < 0.0001) across the CYP+LC groups compared with the Control group. Additionally, Hb levels decreased by approximately 30% (P < 0.05) in the CYP+LC groups relative to both the LC-only and CYP1 groups; however, Hb concentration increased significantly by 63% (P < 0.05) in the CYP3+LC group compared with the CYP3-only group (Figure 1A).
In the TO experimental set, Hb concentration decreased significantly by 41% (P < 0.0001) in CYP2, 59% (P < 0.0001) in CYP3, and 29% (P < 0.01) in CYP2+TO compared with the Control group. Relative to the TO-only group, Hb levels declined by 26% (P < 0.01) in both the CYP1+TO and CYP3+TO groups and by 37% (P < 0.0001) in the CYP2+TO group. Notably, pre-treatment with TO increased Hb concentration by 104% (P < 0.0001) in the CYP3+TO group compared with the CYP3-only group (Figure 1B).
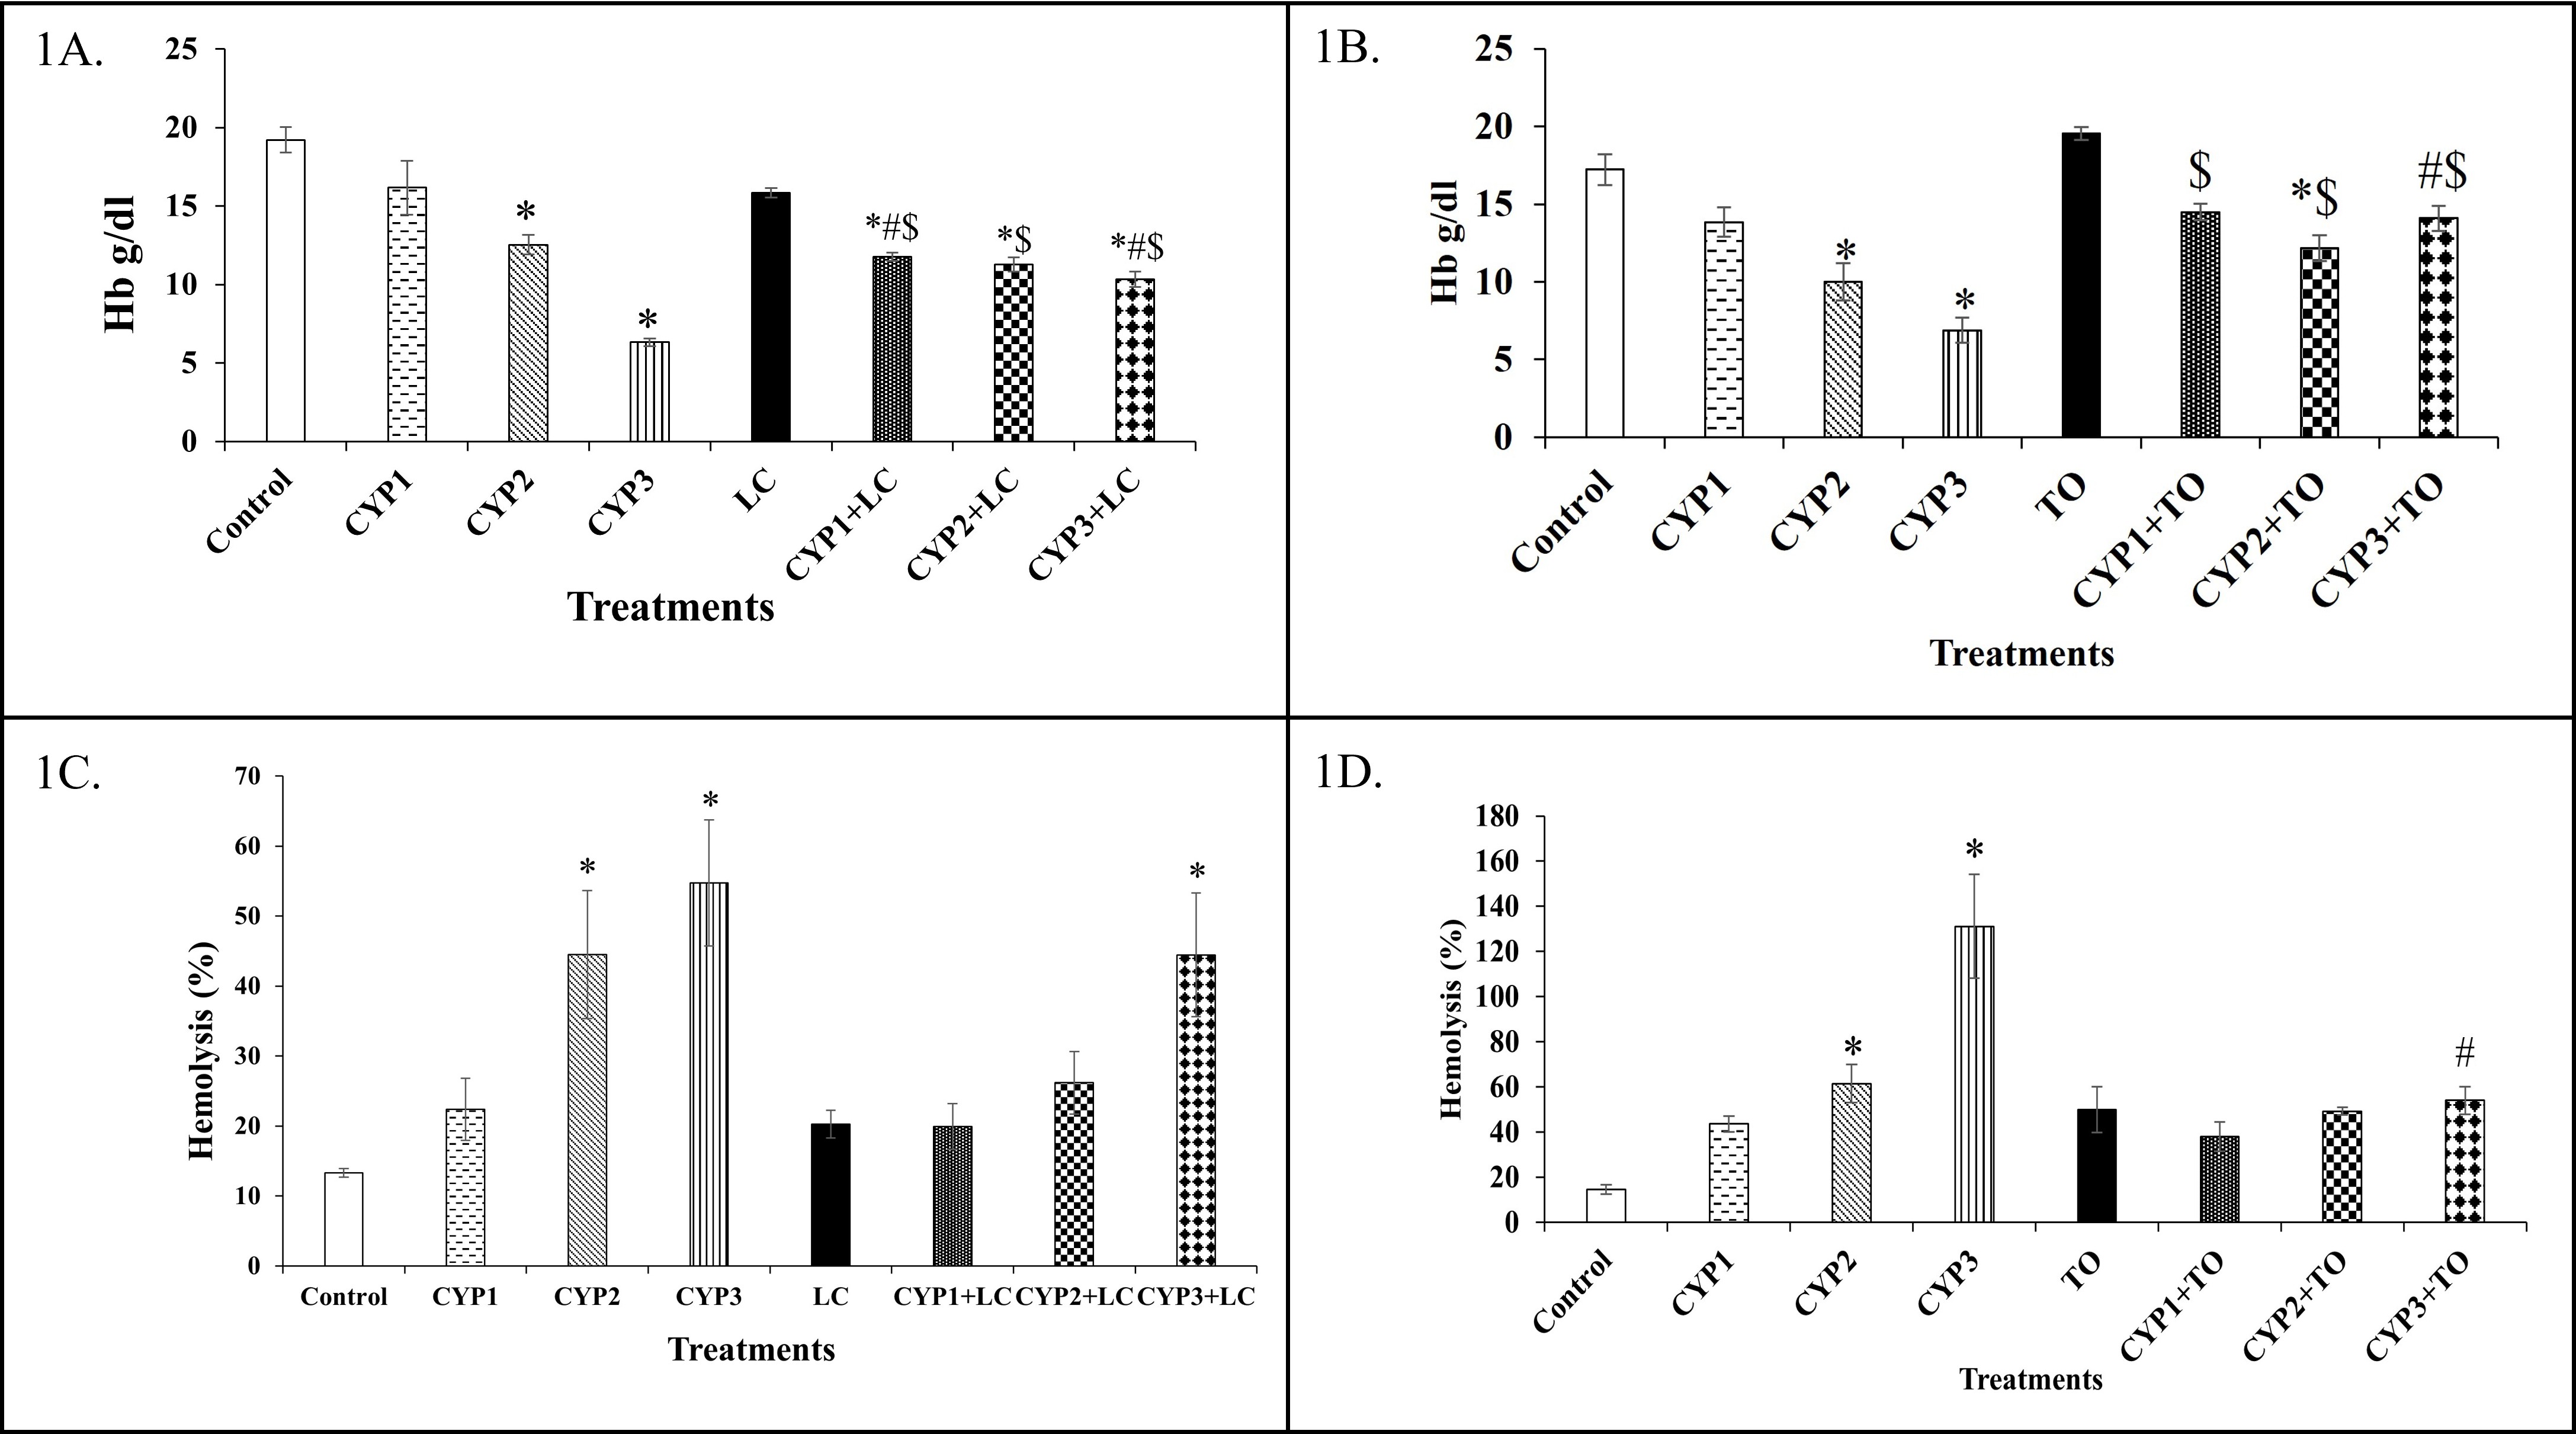
Modulatory effects of L-carnitine and α-tocopherol on hemoglobin concentration and oxidative hemolysis in cyclophosphamide-treated rat erythrocytes. Isolated male Wistar rat erythrocytes (50% hematocrit) were exposed to cyclophosphamide (0.2, 0.4, or 0.8 mM for 1 h at 37 °C) alone or following pre-incubation with either 10 mM L-carnitine or 2 mM α-tocopherol for 2 h at 37 °C. Hemoglobin (Hb) levels were quantified spectrophotometrically at 540 nm using the cyanmethemoglobin method, and percentage hemolysis was assessed in a 5% erythrocyte suspension challenged with 1% H₂O₂ for 1 h at 37 °C. (A) Hemoglobin concentration in erythrocytes treated with cyclophosphamide and L-carnitine (n = 7). (B) Hemoglobin concentration in erythrocytes treated with cyclophosphamide and α-tocopherol (n = 6). (C) Percentage hemolysis in erythrocytes treated with cyclophosphamide and L-carnitine (n = 7). (D) Percentage hemolysis in erythrocytes treated with cyclophosphamide and α-tocopherol (n = 6). Data are expressed as mean ± standard error of the mean (SEM), with error bars representing SEM. Statistical comparisons were performed using one-way analysis of variance (ANOVA) followed by Tukey's post-hoc test in GraphPad Prism version 8.0 (P < 0.05 considered statistically significant). * indicates P < 0.05 compared with the untreated Control group; # indicates P < 0.05 compared with the respective cyclophosphamide-only (CYP) group; $ indicates P < 0.05 compared with the respective antioxidant-only (LC or TO) group. Abbreviations: CYP, cyclophosphamide; CYP1, 0.2 mM cyclophosphamide; CYP2, 0.4 mM cyclophosphamide; CYP3, 0.8 mM cyclophosphamide; Hb, hemoglobin; LC, 10 mM L-carnitine; TO, 2 mM α-tocopherol.
Hemolysis
In the LC experimental set, hemolysis increased significantly by 235% (P < 0.05) in CYP2, 312% (P < 0.001) in CYP3, and 234% (P < 0.05) in CYP3+LC relative to the Control group (Figure 1C).
In the TO experimental set, hemolysis increased sharply by 320% (P < 0.05) in CYP2 and 800% (P < 0.0001) in CYP3 compared with the Control group. Conversely, pre-treatment with TO significantly reduced hemolysis by 58% (P < 0.001) in the CYP3+TO group compared with the CYP3-only group (Figure 1D).
Superoxide Dismutase (SOD)
In the LC experimental set, SOD activity increased by 79% (P < 0.05) in the CYP3 group compared with the Control group (Figure 2A).
In the TO experimental set, SOD activity increased markedly by 461% (P < 0.01) in the TO-only group and by 360% (P < 0.05) in the CYP2+TO group relative to the Control group (Figure 2B).
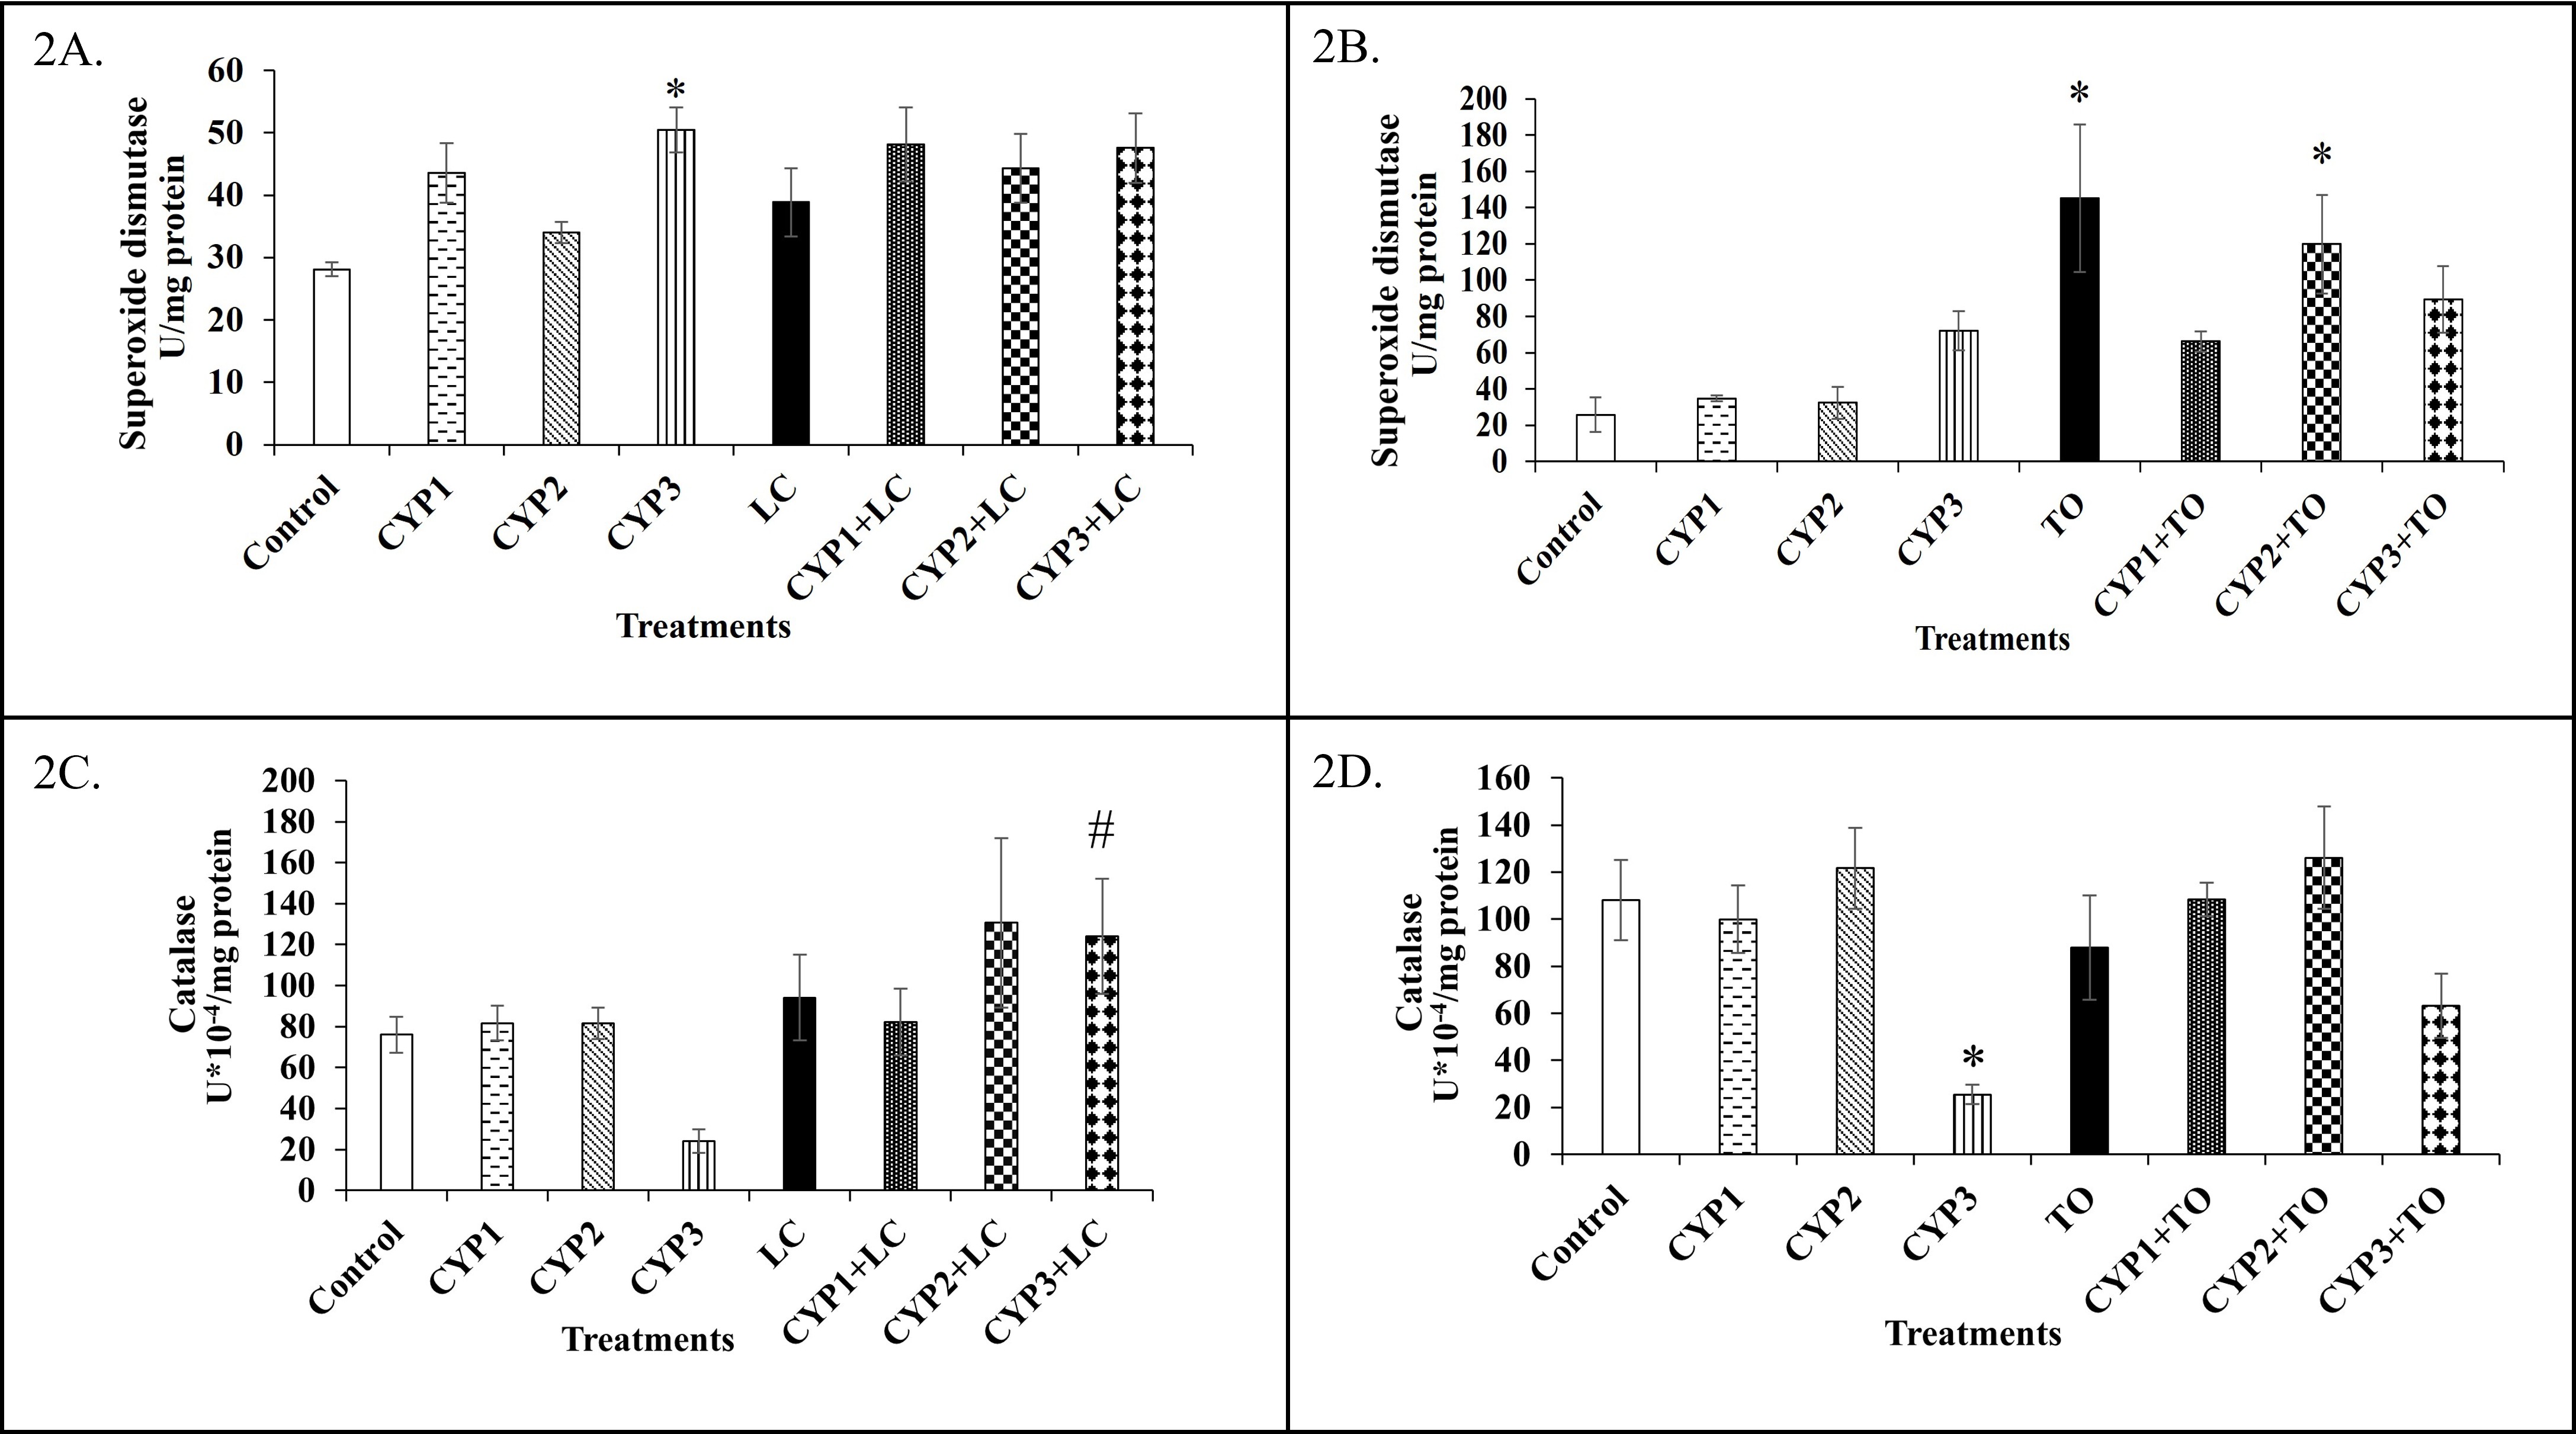
Effects of L-carnitine and α-tocopherol on enzymatic antioxidant activities (superoxide dismutase and catalase) in cyclophosphamide-treated rat erythrocytes. Hemolysates prepared from isolated rat erythrocytes treated with cyclophosphamide (0.2, 0.4, or 0.8 mM for 1 h at 37 °C) alone or following a 2 h pre-incubation with 10 mM L-carnitine or 2 mM α-tocopherol at 37 °C were assayed spectrophotometrically for superoxide dismutase (SOD; inhibition of epinephrine autoxidation at 480 nm) and catalase (CAT; H₂O₂ decomposition at 240 nm) activities. (A) Superoxide dismutase activity in erythrocytes treated with cyclophosphamide and L-carnitine (n = 7). (B) Superoxide dismutase activity in erythrocytes treated with cyclophosphamide and α-tocopherol (n = 6). (C) Catalase activity in erythrocytes treated with cyclophosphamide and L-carnitine (n = 7). (D) Catalase activity in erythrocytes treated with cyclophosphamide and α-tocopherol (n = 6). Data are expressed as mean ± standard error of the mean (SEM), with error bars representing SEM. Statistical comparisons were performed using one-way analysis of variance (ANOVA) followed by Tukey's post-hoc test in GraphPad Prism version 8.0 (P < 0.05 considered statistically significant). * indicates P < 0.05 compared with the untreated Control group; # indicates P < 0.05 compared with the respective cyclophosphamide-only (CYP) group; $ indicates P < 0.05 compared with the respective antioxidant-only (LC or TO) group. Abbreviations: CAT, catalase; CYP, cyclophosphamide; CYP1, 0.2 mM cyclophosphamide; CYP2, 0.4 mM cyclophosphamide; CYP3, 0.8 mM cyclophosphamide; LC, 10 mM L-carnitine; SOD, superoxide dismutase; TO, 2 mM α-tocopherol.
Catalase (CAT)
In the LC experimental set, CAT activity increased 4-fold (P < 0.05) in the CYP3+LC group compared with the CYP3-only group (Figure 2C).
In the TO experimental set, CAT activity decreased by 76% (P < 0.05) in the CYP3 group compared with the Control group (Figure 2D).
Reduced Glutathione (GSH)
In the LC experimental set, GSH levels increased significantly by 80% (P < 0.01) in CYP3, 75% (P < 0.05) in CYP1+LC, 85% (P < 0.01) in CYP2+LC, and 100% (P < 0.001) in CYP3+LC compared with the Control group (Figure 3A).
In the TO experimental set, GSH levels increased 1.5-fold (P < 0.05) in the TO, CYP2+TO, and CYP3+TO groups relative to the Control group (Figure 3B).
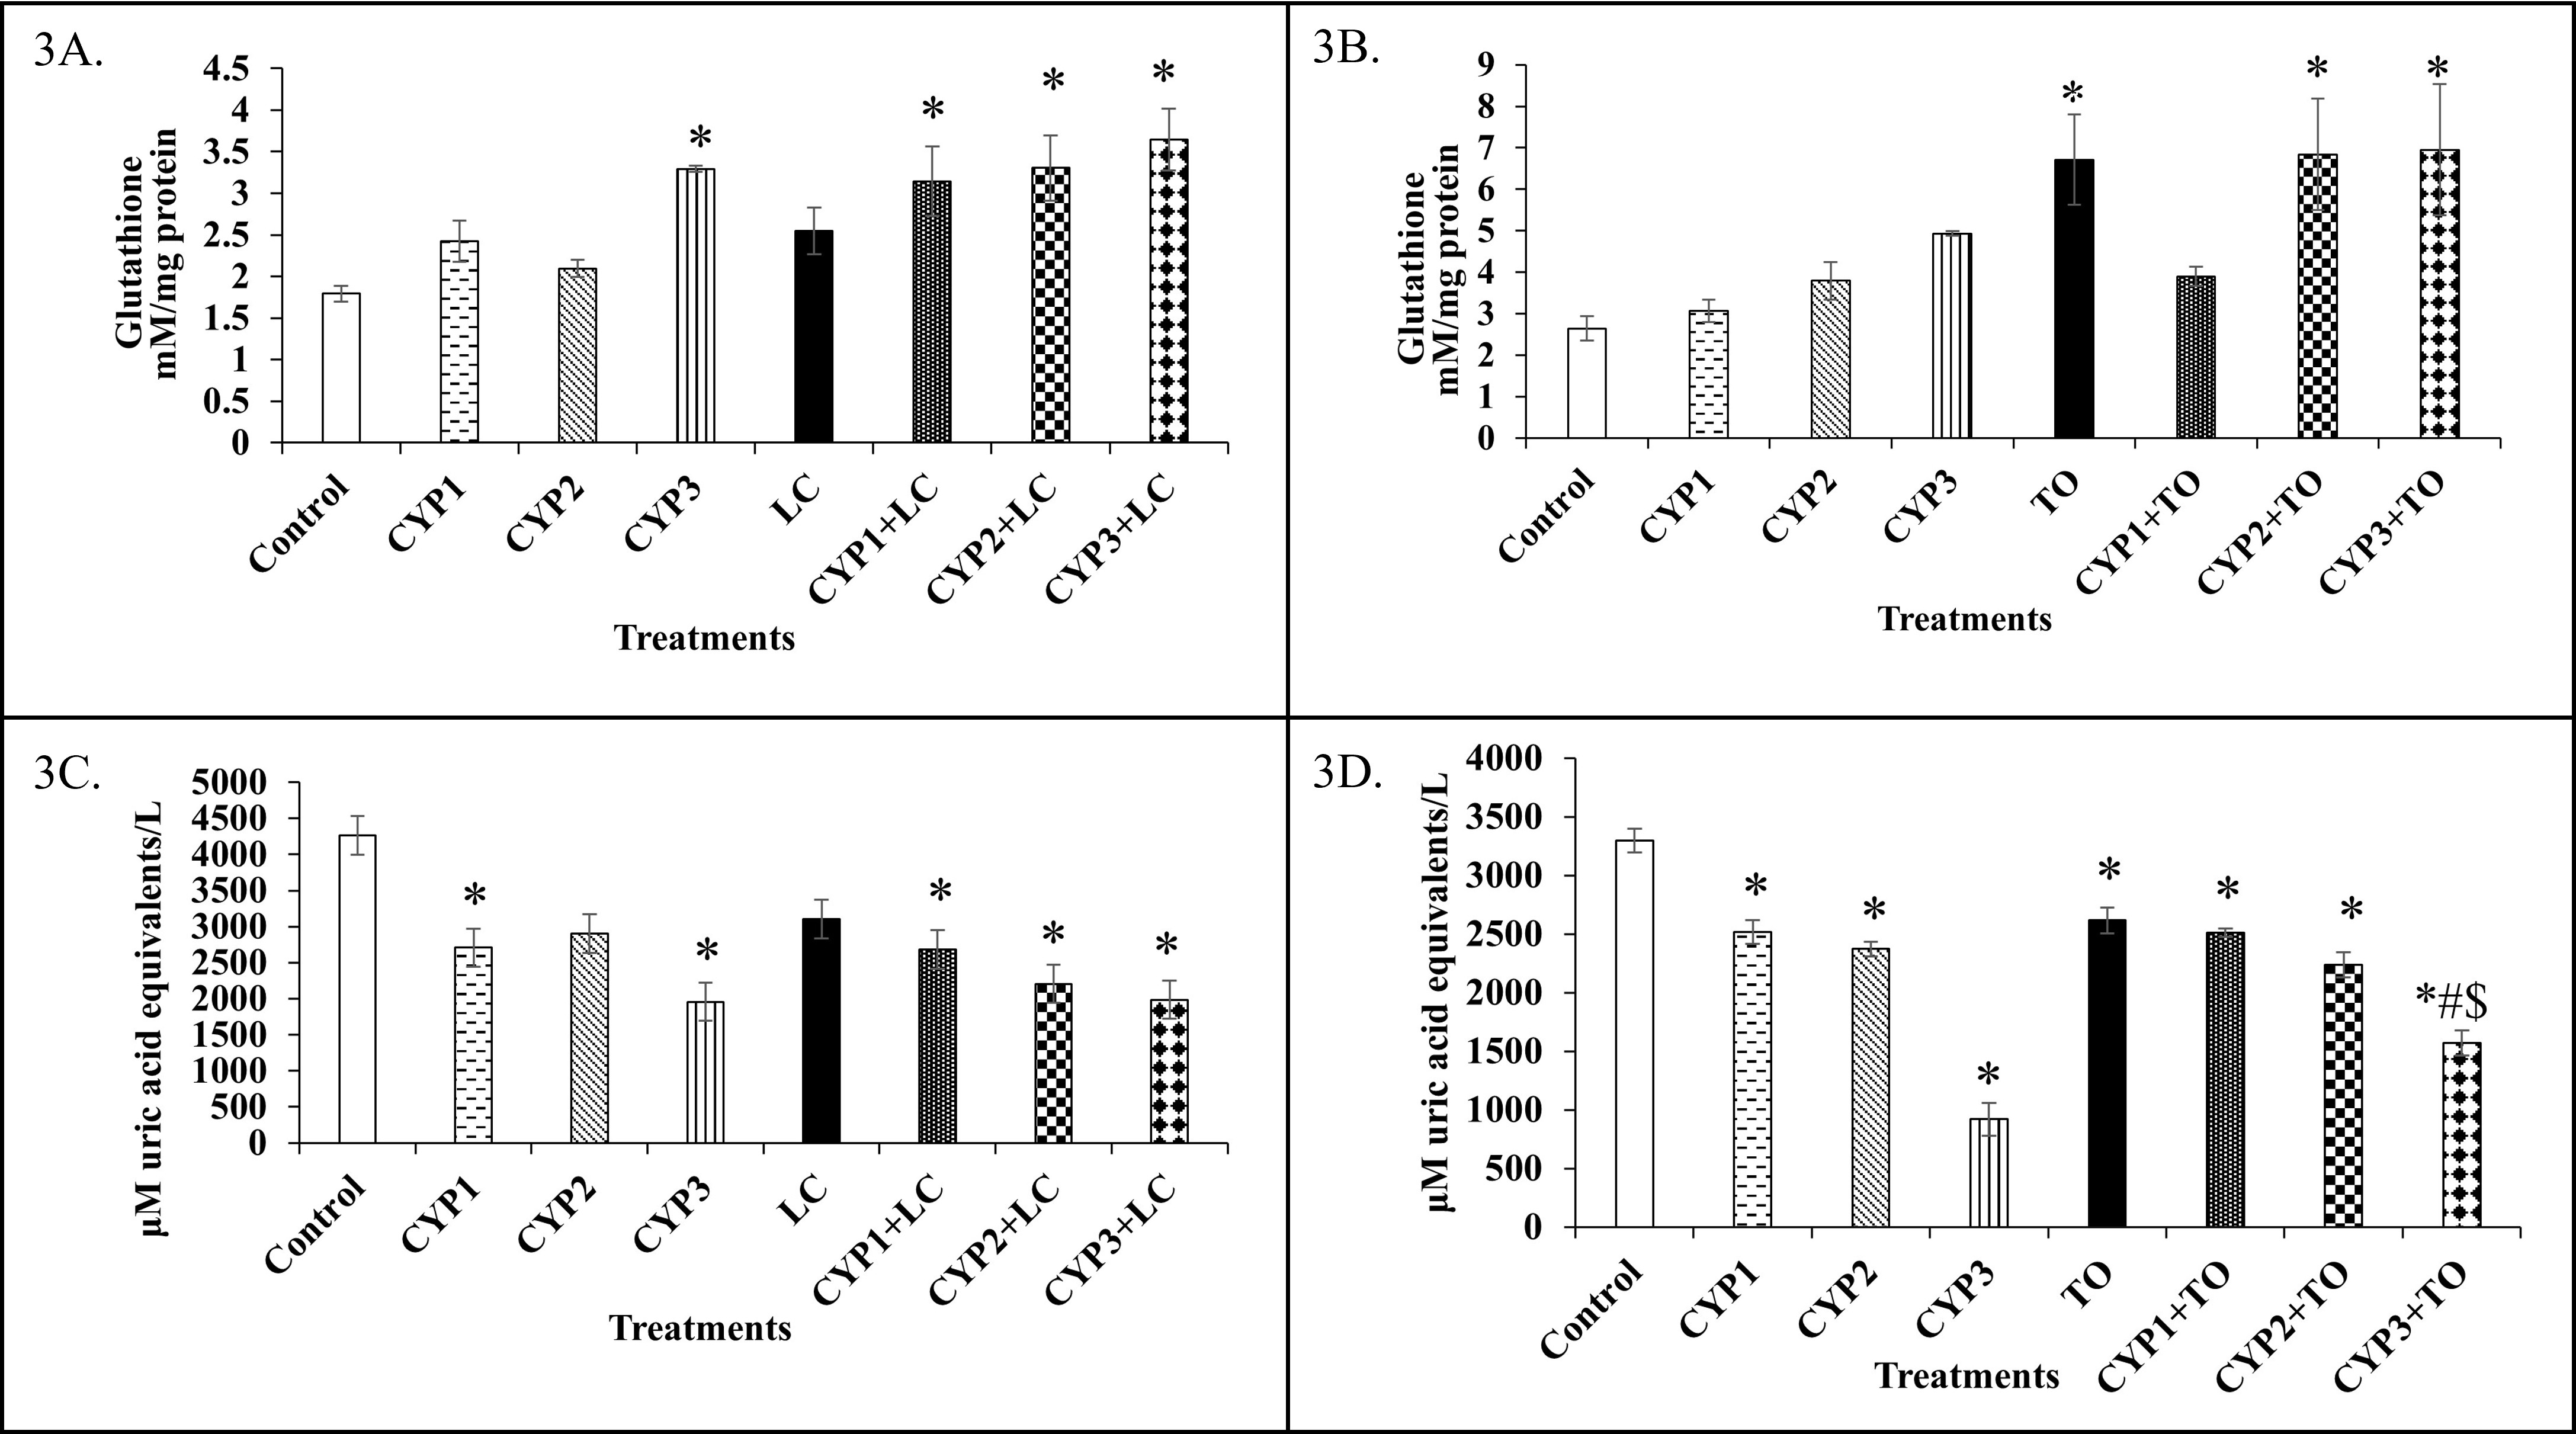
Effects of L-carnitine and α-tocopherol on non-enzymatic antioxidant status (reduced glutathione and total antioxidant capacity) in cyclophosphamide-treated rat erythrocytes. Hemolysates from isolated rat erythrocytes exposed to cyclophosphamide (0.2, 0.4, or 0.8 mM for 1 h at 37 °C) alone or after a 2 h pre-incubation with 10 mM L-carnitine or 2 mM α-tocopherol at 37 °C were analyzed for reduced glutathione (GSH; Ellman's DTNB assay at 412 nm) and total antioxidant capacity via the cupric ion-reducing antioxidant capacity–bathocuproinedisulfonic acid (CUPRAC-BCS) assay at 490 nm. (A) Reduced glutathione levels in erythrocytes treated with cyclophosphamide and L-carnitine (n = 7). (B) Reduced glutathione levels in erythrocytes treated with cyclophosphamide and α-tocopherol (n = 6). (C) Total antioxidant capacity (CUPRAC-BCS assay) in erythrocytes treated with cyclophosphamide and L-carnitine (n = 7). (D) Total antioxidant capacity (CUPRAC-BCS assay) in erythrocytes treated with cyclophosphamide and α-tocopherol (n = 6). Data are expressed as mean ± standard error of the mean (SEM), with error bars representing SEM. Statistical comparisons were performed using one-way analysis of variance (ANOVA) followed by Tukey's post-hoc test in GraphPad Prism version 8.0 (P < 0.05 considered statistically significant). * indicates P < 0.05 compared with the untreated Control group; # indicates P < 0.05 compared with the respective cyclophosphamide-only (CYP) group; $ indicates P < 0.05 compared with the respective antioxidant-only (LC or TO) group. Abbreviations: BCS, bathocuproinedisulfonic acid; CUPRAC, cupric ion-reducing antioxidant capacity; CYP, cyclophosphamide; CYP1, 0.2 mM cyclophosphamide; CYP2, 0.4 mM cyclophosphamide; CYP3, 0.8 mM cyclophosphamide; DTNB, 5,5′-dithiobis-(2-nitrobenzoic acid); GSH, reduced glutathione; LC, 10 mM L-carnitine; TO, 2 mM α-tocopherol.
Cupric Ion-Reducing Antioxidant Capacity (CUPRAC-BCS)
In the LC experimental set, TAC measured via the CUPRAC-BCS assay decreased by 35% (P < 0.05) in both CYP1 and CYP1+LC, 30% (P < 0.05) in CYP2, 48% (P < 0.01) in CYP2+LC, and 55% (P < 0.001) in both CYP3 and CYP3+LC compared with the Control group (Figure 3C).
In the TO experimental set, CUPRAC values decreased significantly (P < 0.0001) across all CYP and CYP+TO groups relative to the Control group, with reductions of approximately 25% in CYP1 and CYP2, 72% in CYP3, 23% in CYP1+TO, 32% in CYP2+TO, and 52% in CYP3+TO, alongside a 20% reduction (P < 0.001) in the TO-only group. Furthermore, CUPRAC levels were 40% lower (P < 0.0001) in CYP3+TO than in the TO-only group, but increased significantly by 70% (P < 0.001) in CYP3+TO compared with the CYP3-only group (Figure 3D).
Superoxide Radicals
In the LC experimental set, superoxide radical generation increased by 95% (P < 0.05) in the CYP2+LC group compared with the Control group, whereas it decreased by 50% (P < 0.05) in the CYP3+LC group relative to the LC-only group (Table 2).
Effects of L-carnitine pre-treatment on reactive species, protein oxidation, lipid peroxidation, and lactate dehydrogenase activity in cyclophosphamide-treated rat erythrocytes.
| Group | Superoxide Radicals (mM/mg protein) | Nitrites (mM/mg protein) | AOPP (µM/mg protein) | P-SH (µM/mg protein) | MDA (µM/mg protein) | LDH (U × 10⁻⁶/mg protein) |
|---|---|---|---|---|---|---|
| Control | 0.06 ± 0.01 | 3.33 ± 0.32 | 7.80 ± 0.62 | 382.15 ± 83.09 | 14.89 ± 4.92 | 10.50 ± 1.24 |
| CYP1 | 0.09 ± 0.01 | 3.75 ± 0.37 | 11.83 ± 1.57 | 382.27 ± 63.61 | 37.74 ± 14.72 | 11.38 ± 9.29 |
| CYP2 | 0.09 ± 0.01 | 3.18 ± 0.22 | 10.64 ± 1.68 | 58.77 ± 20.54* | 32.63 ± 7.99 | 10.86 ± 2.86 |
| CYP3 | 0.10 ± 0.02 | 4.36 ± 0.13 | 10.75 ± 0.49 | 567.96 ± 65.95 | 24.04 ± 12.43 | 6.93 ± 4.94 |
| LC | 0.11 ± 0.01 | 3.09 ± 0.38 | 9.66 ± 1.46 | 322.47 ± 49.52 | 45.17 ± 17.31 | 14.59 ± 3.11 |
| CYP1+LC | 0.10 ± 0.01 | 3.77 ± 0.38 | 10.40 ± 1.29 | 358.68 ± 43.70 | 54.11 ± 8.32 | 5.20 ± 4.01 |
| CYP2+LC | 0.11 ± 0.01* | 4.45 ± 0.51 | 12.43 ± 0.69 | 334.78 ± 59.23# | 77.88 ± 19.39* | 8.67 ± 4.62 |
| CYP3+LC | 0.05 ± 0.01$ | 4.80 ± 0.50$ | 11.71 ± 1.38 | 416.07 ± 73.18 | 41.81 ± 8.12 | 13.63 ± 2.32 |
In the TO experimental set, variations in superoxide radical levels across the CYP, TO, and CYP+TO groups were statistically non-significant compared with the Control group (Table 3).
Effects of α-tocopherol pre-treatment on reactive species, protein oxidation, lipid peroxidation, and lactate dehydrogenase activity in cyclophosphamide-treated rat erythrocytes.
| Group | Superoxide Radicals (mM/mg protein) | Nitrites (mM/mg protein) | AOPP (µM/mg protein) | P-SH (µM/mg protein) | MDA (µM/mg protein) | LDH (U × 10⁻⁶/mg protein) |
|---|---|---|---|---|---|---|
| Control | 0.10 ± 0.02 | 4.44 ± 0.63 | 10.59 ± 1.10 | 326.40 ± 92.98 | 22.78 ± 3.38 | 14.86 ± 2.96 |
| CYP1 | 0.09 ± 0.01 | 7.52 ± 1.52 | 8.99 ± 1.26 | 282.93 ± 31.67 | 27.65 ± 1.82 | 18.09 ± 1.62 |
| CYP2 | 0.06 ± 0.01 | 6.09 ± 0.65 | 13.00 ± 1.45 | 355.80 ± 29.78 | 60.89 ± 8.73 | 14.20 ± 1.85 |
| CYP3 | 0.08 ± 0.01 | 8.13 ± 0.74 | 14.45 ± 0.48 | 310.41 ± 97.52 | 61.93 ± 8.60 | 20.85 ± 2.24 |
| TO | 0.16 ± 0.08 | 8.70 ± 1.44 | 23.29 ± 4.56 | 1111.43 ± 323.76* | 62.38 ± 11.58 | 37.79 ± 5.53* |
| CYP1+TO | 0.09 ± 0.02 | 5.31 ± 0.26 | 6.24 ± 0.67$ | 182.73 ± 22.21$ | 123.17 ± 39.31$ | 16.46 ± 5.11$ |
| CYP2+TO | 0.12 ± 0.03 | 8.91 ± 1.71 | 11.04 ± 2.33 | 640.52 ± 95.64 | 201.63 ± 48.79*#$ | 16.19 ± 5.19 |
| CYP3+TO | 0.06 ± 0.02 | 8.77 ± 2.05 | 19.27 ± 4.97 | 661.18 ± 35.52 | 72.66 ± 16.60 | 20.29 ± 5.89 |
Nitrites
In the LC experimental set, nitrite levels increased by 55% (P < 0.05) in the CYP3+LC group compared with the LC-only group (Table 2).
In the TO experimental set, nitrite concentrations did not differ significantly among the CYP, TO, and CYP+TO groups relative to the Control group (Table 3).
Advanced Oxidation Protein Products (AOPP)
In the LC experimental set, AOPP levels showed no statistically significant differences across the CYP, LC, and CYP+LC groups compared with the Control group (Table 2).
In the TO experimental set, AOPP levels decreased significantly by 73% (P < 0.01) in the CYP1+TO group compared with the TO-only group (Table 3).
Protein Sulfhydryls (P-SH)
In the LC experimental set, P-SH content decreased significantly by 84% (P < 0.01) in the CYP2 group relative to the Control group, but increased 4.6-fold (P < 0.05) in the CYP2+LC group compared with the CYP2-only group (Table 2).
In the TO experimental set, P-SH levels increased by 240% (P < 0.01) in the TO-only group compared with the Control group, whereas P-SH levels decreased by 83% (P < 0.001) in the CYP1+TO group relative to the TO-only group (Table 3).
Malondialdehyde (MDA)
In the LC experimental set, MDA concentrations increased 4.2-fold (P < 0.05) in the CYP2+LC group compared with the Control group (Table 2).
In the TO experimental set, MDA levels increased markedly by 7.8-fold (P < 0.001) in the CYP2+TO group relative to the Control group, and were 2.0-fold (P < 0.01) and 2.3-fold (P < 0.01) higher in the CYP2+TO group than in the TO-only and CYP2-only groups, respectively (Table 3).
Lactate Dehydrogenase (LDH)
In the LC experimental set, variations in LDH activity across the CYP, LC, and CYP+LC groups were statistically non-significant compared with the Control group (Table 2).
In the TO experimental set, LDH activity increased by 154% (P < 0.01) in the TO-only group relative to the Control group, whereas it decreased by 56% (P < 0.05) in the CYP1+TO group compared with the TO-only group (Table 3).
DISCUSSION
Cyclophosphamide (CYP) is a cytotoxic nitrogen mustard alkylating agent that impairs erythrocyte membrane integrity and intracellular enzyme function. Specifically, CYP induces cellular OS primarily by accelerating ROS generation and depleting endogenous antioxidant reserves. Reactive metabolites of CYP mobilize intracellular ferrous ions (Fe²⁺), catalyzing Fenton-type reactions that yield highly destructive hydroxyl radicals (•OH), thereby amplifying oxidative injury and diminishing total cellular antioxidant capacity5. At elevated concentrations, CYP markedly increases intracellular ROS production, while its reactive aldehyde metabolite acrolein promotes the formation of reactive nitrogen species (RNS)23. An additional cytotoxic mechanism involves the reaction of superoxide anions with nitric oxide (NO•) to generate peroxynitrite (ONOO⁻)24, a potent oxidant that initiates lipid peroxidation and irreversible protein modification25. Notably, CYP can trigger intracellular ROS production under in vitro and ex vivo conditions even in the absence of hepatic cytochrome P450 activation by modulating signaling cascades such as the phosphoinositide 3-kinase (PI3K)/Akt/mechanistic target of rapamycin (mTOR) pathway, NADPH oxidase complexes, and electron transport chains. Tyrosine kinase-mediated activation of PI3K promotes the translocation of the cytosolic subunit p47phox to the plasma membrane and stimulates NADPH oxidase phosphorylation, further driving superoxide and ROS generation26.
Control vs. Cyclophosphamide (CYP)
In the present study, Hb levels declined significantly in CYP-exposed erythrocytes, reflecting the oxidative conversion of ferrous hemoglobin (Fe²⁺) into non-functional ferric methemoglobin (MetHb; Fe³⁺) under elevated ROS burden. Erythrocytes treated with the lowest concentration of CYP (0.2 mM; CYP1) largely maintained redox equilibrium through compensatory activation of endogenous antioxidant defenses, as evidenced by stable SOD, CAT, GSH, P-SH, and lipid peroxidation profiles. However, higher concentrations of CYP (0.4 and 0.8 mM) induced substantial free radical generation that overwhelmed intrinsic cellular defenses, resulting in pronounced Hb depletion, P-SH oxidation (in CYP2), and severe hemolysis. The significant elevation of SOD activity observed in the CYP3 group paralleled the heightened superoxide burden, indicating an adaptive enzymatic response to dismutate excess superoxide radicals into H₂O₂. Nevertheless, the resulting accumulation of intracellular H₂O₂ depleted overall TAC, as reflected by the dose-dependent decline in CUPRAC values across all CYP groups. Reduced glutathione (GSH) directly neutralizes free radicals and preserves protein sulfhydryl groups in their reduced thiol state27. Although both GSH levels and SOD activity were elevated in the CYP3 group, total antioxidant capacity and CAT activity declined markedly because excessive H₂O₂ accumulation inhibits catalase via the formation of inactive Complex II/III28. Because erythrocyte hemolysis serves as an integrated functional indicator of cumulative lipid peroxidation and membrane protein oxidation29, the marked rise in hemolysis observed in the CYP2 and CYP3 groups directly reflects dose-dependent oxidative membrane destabilization induced by CYP.
Modulatory Effects of L-Carnitine (LC)
CYP+LC vs. Control
L-Carnitine functions as an antioxidant by directly scavenging free radicals, chelating catalytic transition metal ions, and inhibiting oxidant-generating enzymes, thereby modulating cellular redox balance6. When evaluated against CYP-induced OS, Hb concentrations remained significantly lower in the CYP+LC groups than in the untreated Control group, indicating persistent ROS-mediated oxidation of Hb to MetHb. Conversely, intracellular GSH levels were substantially elevated across all CYP+LC groups relative to the Control group. Glutathione reductase catalyzes the NADPH-dependent reduction of oxidized glutathione disulfide (GSSG) back to biologically active GSH30, and LC supplementation is known to promote GSH recycling and synthesis31. Despite this upregulation of GSH, overall TAC (CUPRAC) remained depressed in the CYP+LC groups, consistent with the elevated superoxide radical and MDA levels observed in CYP2+LC. This persistent oxidative burden likely stems from continuous reactive intermediate generation during CYP exposure26. Consequently, hemolysis remained significantly elevated in the CYP3+LC group compared with the Control group, demonstrating that although 10 mM LC bolstered glutathione reserves, high-dose CYP (0.8 mM) exceeded the membrane-protective threshold of LC and increased erythrocyte osmotic and oxidative fragility.
CYP+LC vs. CYP
When compared directly with the respective CYP-only groups, pre-treatment with 10 mM LC significantly preserved Hb in its reduced state at the highest drug concentration (CYP3+LC vs. CYP3) and restored P-SH levels at the intermediate concentration (CYP2+LC vs. CYP2). Furthermore, in the CYP3+LC group, LC supplementation produced a 4-fold increase in CAT activity compared with CYP3 alone, preventing H₂O₂-mediated catalase inactivation. However, despite enhancing specific intracellular antioxidant defenses (CAT, GSH, and P-SH), LC did not significantly reduce hemolysis compared with CYP alone, indicating incomplete protection of the erythrocyte lipid bilayer against CYP-induced lysis.
Modulatory Effects of α-Tocopherol (TO)
CYP+TO vs. Control
α-Tocopherol is a primary lipophilic antioxidant that quenches lipid peroxyl radicals by donating a phenolic hydrogen atom—forming a resonance-stabilized α-tocopheryl radical—and is subsequently regenerated in synergy with ascorbate and thiol networks27. Under CYP-induced OS conditions, Hb levels were moderately reduced in the CYP2+TO group relative to the Control group, whereas SOD activity was markedly elevated in both the TO-only and CYP2+TO groups. Furthermore, GSH concentrations increased 1.5-fold in the TO, CYP2+TO, and CYP3+TO groups while P-SH levels were maintained at or above baseline Control values, indicating that 2 mM TO preserved intracellular thiol redox homeostasis via NADPH-dependent glutathione reductase recycling27. Although overall CUPRAC values remained lower than Control levels and MDA was elevated in the CYP2+TO group due to CYP-driven radical generation, TO supplementation effectively prevented any significant rise in hemolysis relative to the Control group across all CYP concentrations.
CYP+TO vs. CYP
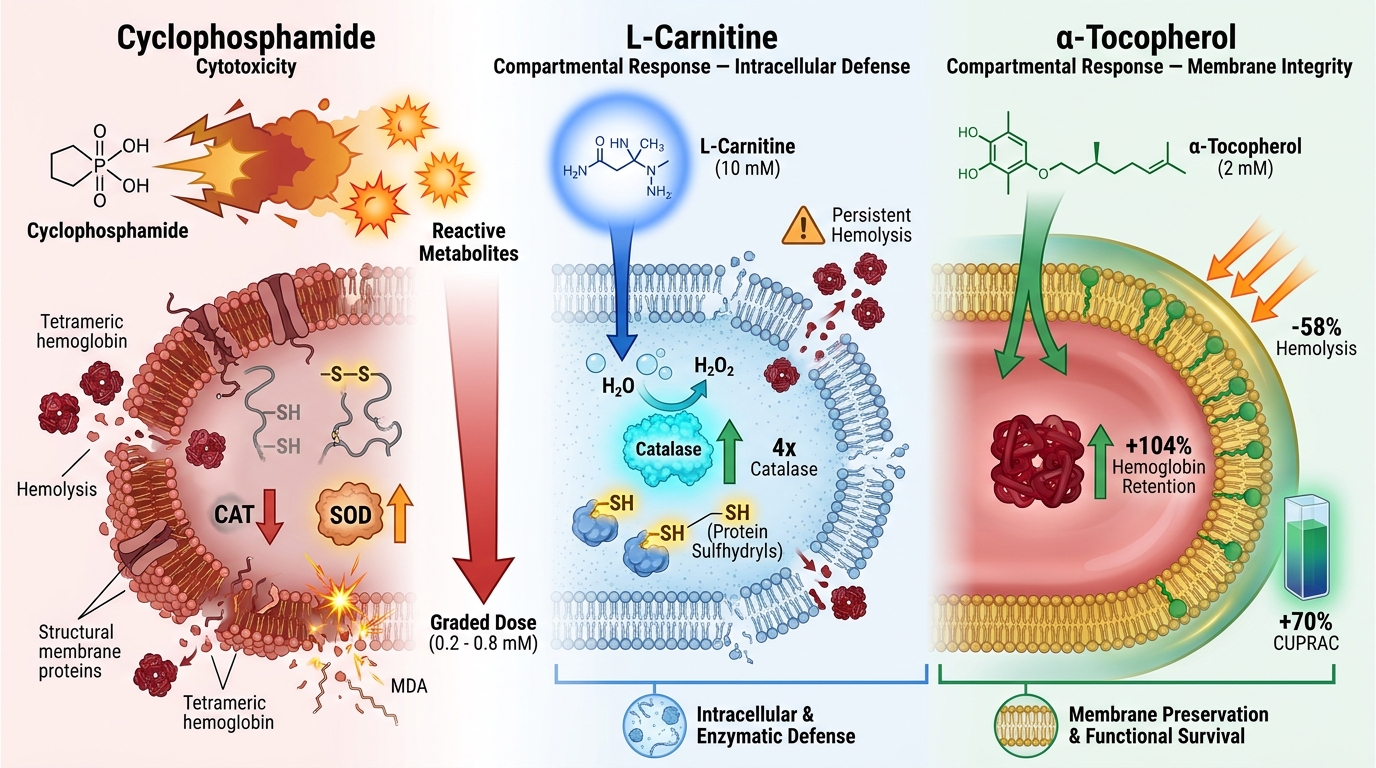
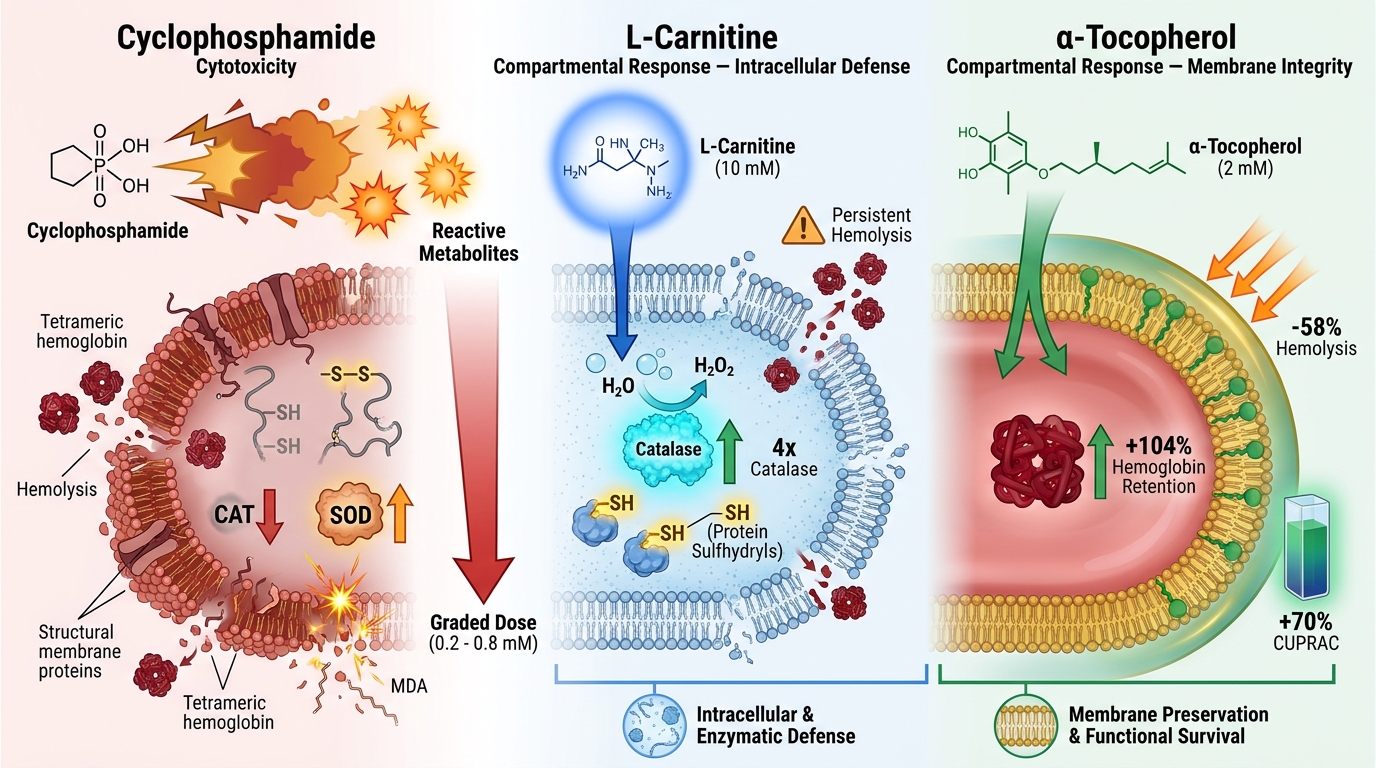
Within the erythrocyte membrane lipid bilayer, α-tocopherol intercepts polyunsaturated fatty acid peroxidation by donating a hydrogen atom from the hydroxyl moiety of its chromanol ring to neutralize lipid peroxyl radicals, thereby terminating free radical chain propagation32. In the present study, pre-treatment with 2 mM TO maintained erythrocytes in a more reduced state across the CYP+TO groups compared with the corresponding CYP-only groups. Specifically, at the highest concentration of cyclophosphamide (0.8 mM; CYP3+TO vs. CYP3), TO pre-treatment doubled Hb retention (+104%), enhanced total antioxidant capacity (+70% in CUPRAC), and reduced hemolysis by 58%. Although TO did not prevent MDA accumulation in the CYP2+TO group, its ability to partition directly into the phospholipid bilayer stabilized the erythrocyte membrane and markedly attenuated CYP-induced hemolysis.
CONCLUSION
Both L-carnitine and α-tocopherol modulated intracellular antioxidant defenses during cyclophosphamide-induced oxidative stress in rat erythrocytes. L-Carnitine upregulated reduced glutathione, catalase activity, and protein sulfhydryls, conferring partial protection against protein oxidation and hemoglobin loss. In contrast, α-tocopherol markedly attenuated hemolysis, preserved hemoglobin levels, and significantly improved total antioxidant capacity—particularly at high cyclophosphamide concentrations (0.8 mM)—demonstrating a robust, dose-dependent membrane-stabilizing effect. Collectively, α-tocopherol proved more effective than L-carnitine in protecting erythrocytes against cyclophosphamide-induced oxidative membrane injury. These findings highlight the distinct mechanistic profiles of hydrophilic (L-carnitine) and lipophilic (α-tocopherol) antioxidants and validate isolated erythrocytes as a reliable ex vivo model for investigating chemotherapy-induced oxidative stress.
DECLARATIONS
Abbreviations
AOPP: Advanced oxidation protein products; ANOVA: Analysis of variance; BCS: Bathocuproinedisulfonic acid disodium salt hydrate; BSA: Bovine serum albumin; CAT: Catalase; CCSEA: Committee for the Purpose of Control and Supervision of Experiments on Animals; CPDA-1: Citrate-phosphate-dextrose-adenine; CUPRAC-BCS: Cupric ion-reducing antioxidant capacity–bathocuproinedisulfonic acid assay; CYP: Cyclophosphamide; DTNB: 5,5′-Dithiobis-(2-nitrobenzoic acid); EDTA: Ethylenediaminetetraacetic acid disodium salt; GSH: Reduced glutathione; GSSG: Oxidized glutathione disulfide; GSSG-R: Glutathione reductase; Hb: Hemoglobin; LC: L-Carnitine; LDH: Lactate dehydrogenase; MDA: Malondialdehyde; MetHb: Methemoglobin; NADH: Reduced nicotinamide adenine dinucleotide; NADPH: Reduced nicotinamide adenine dinucleotide phosphate; OS: Oxidative stress; PB: Phosphate buffer; PI3K: Phosphoinositide 3-kinase; P-SH: Protein sulfhydryls; RNS: Reactive nitrogen species; ROS: Reactive oxygen species; SDS: Sodium dodecyl sulfate; SEM: Standard error of the mean; SOD: Superoxide dismutase; TAC: Total antioxidant capacity; TO: α-Tocopherol
Acknowledgments
The authors gratefully acknowledge JAIN (Deemed-to-be University), Bengaluru, and Nargund College of Pharmacy, Bengaluru, for providing the facilities and institutional support required to conduct this study. The authors also thank Dr. Sowmya R., Dr. Carl Hsieh, Dr. Manasa Mithun, and Dr. M. Pallavi for their valuable technical assistance and scholarly support.
Author’s contributions
Chandan Gowda Hanchipura Narasimhaiah, Sujay Nagendrappa Baligar, Varun Rao Shantha Kumar, Prathyusha Idyadka Chidananda, and Jennifer Margaret Devathanam performed the experiments and curated and analyzed the data. Chandan Gowda Hanchipura Narasimhaiah, Anusha Berikai Ananthakrishna, and Magdaline Christina Rajanand prepared the data visualizations and drafted the original manuscript. Anusha Berikai Ananthakrishna critically reviewed and edited the manuscript. Vani Rajashekaraiah conceptualized the study, designed the experimental methodology, supervised the research, reviewed and edited the manuscript, and oversaw project administration. All authors read and approved the final manuscript.
Funding
None. No specific funding was received from any public, commercial, or not-for-profit agency to conduct this study.
Availability of data and materials
The datasets generated and analyzed during the current study are available from the corresponding author upon reasonable request.
Ethics approval and consent to participate
Ethical approval for all animal procedures was obtained from the Institutional Animal Ethics Committee of Nargund College of Pharmacy, Bengaluru, India (Approval No. IAEC/NCP/133/2023), and animal procurement and maintenance were conducted in accordance with the guidelines of the Committee for the Purpose of Control and Supervision of Experiments on Animals (Registration No. 1810/PO/RcBiBt/S/15/CCSEA). Consent to participate: None (not applicable, as this study did not involve human participants).
Consent for publication
None.
Declaration of generative AI and AI-assisted technologies in the writing process
None. The authors declare that no generative AI or AI-assisted technologies were used in the writing process prior to submission.
Competing interests
None. The authors declare that they have no competing interests.