


Evaluation of body weight, serum glucose level and oxidative stress parameters of diabetic rats administered phenolic aqueous leaf extract of Vitex doniana
- Department of Biochemistry, Federal University of Technology, Owerri, Nigeria
- Department of Biochemistry, Imo State University, Owerri, Nigeria
Abstract
Background: The present study evaluated the effect of phenolic aqueous leaf extract of Vitex doniana on body weight, serum glucose and oxidative stress parameters in diabetes mellitus (DM) rats.
Methods: DM was induced in rats by intraperitoneal injection of 100 mg/kg alloxan monohydrate in phosphate buffered saline (PBS; pH = 7.4). A total of 36 adult male Wister albino rats were divided into 6 groups of 6 rats. The groups consist of normal untreated rats, untreated DM rats, DM rats treated with 500 mg/kg dimethylguanide (MetforminTM) and DM rats treated with 100, 200 and 400 mg/kg body weight of phenolic aqueous leaf extract of Vitex doniana. The rats were treated for 28 days. Serum glucose, malondialdehyde (MDA), glutathione (GSH) and ascorbic acid concentrations, and serum superoxide dismutase (SOD) and catalase (CAT) activities were measured using standard methods. The changes in body weight was also measured.
Results: The results showed a significant reduction (p < 0.05) in serum glucose and MDA concentration, whereas serum SOD, CAT activities, as well as GSH and ascorbic acid concentration were significantly elevated (p < 0.05) in treated DM groups in a dose dependent manner.
Conclusion: The results of the present study indicated that phenolic aqueous leaf extract of V. doniana promoted increased body weight, ameliorated DM and alleviated reduced antioxidant activities in alloxan-induced DM rats. Phenolic aqueous leaf extract of V. doniana could serve as a potential natural and safe remedy for the management of DM.
Introduction
Diabetes mellitus (DM), a leading metabolic disorder worldwide, is characterized by hyperglycemia caused by impairment in insulin secretion and/or insulin action engendering alteration in carbohydrate, protein and lipid intermediary metabolism. This disease occurs throughout the world and has become a challenge to public health delivery system in developing countries due to steady increased prevalence and the absence of adequate treatment, which is currently expensive or unavailable. The increasing prevalence of DM in developing countries has been linked to trends in urbanization and lifestyle changes, including “Western-style” diet1. Numerous experimental and clinical observations have indicated that hyperglycemia may directly or indirectly contribute to excessive formation of free radicals2. DM alters lipid metabolism and causes oxidative stress3. Oxidative stress in cells and tissues is a result of increased generation of reactive oxygen species (ROS)4. Lipid peroxidation of cellular structures, a consequence of free radical activity, plays important roles in aging and complications of DM5,6. Excessive levels of ROS disrupt natural antioxidant defense systems and alter antioxidant enzyme activities in various tissues7.
Secondary plant metabolites have been shown to modify biological processes, which may reduce the risk of chronic diseases in humans6. In recent years, there has been increasing interest in finding natural antioxidants from plant materials because synthetic antioxidants have been implicated in cellular toxicity8. The most important substance of these natural antioxidants are flavonoids and phenolic compounds9. Plant phenolics are a major group of compounds that act as primary antioxidants or free radical scavengers9,10. Therefore, the present study evaluated the effect of phenolic aqueous leaf extract of Vitex doniana on body weight, serum glucose concentration and oxidative stress parameters of alloxan-induced DM rats.
Methods
Collection and preparation of plant materials
Natural habitats in Mgbaleze, Onicha LGA, Ebonyi State, which lies on the rainforest belt of Nigeria (Latitude 6°15’N; Longitude 8°05’E), served as sources of fresh leaves of V. doniana. Professor S.C. Onyekwelu of the Department of Biology, Ebonyi State University, Abakaliki, Nigeria identified and authenticated the plant specimens. The collection and preparation of the plant materials were following the previously described protocol11.
Preparation of phenolic aqueous leaf extract
Preparation of aqueous phenolic aqueous leaf extract was according to the methods of Iwueke and Nwodo12. A 500 g part of the fresh leaves was dried to constant weight in an oven at 50°C for 10-12 h13. The dried leaf sample was ground into powder using a milling machine. The ground sample was sieved on a wire mesh screen (3 x 3 mm). Finally, the sample was kept at 4°C in air-tight plastic bottles with screw caps pending extraction.
A 250 g of the prepared dried leaf sample was soaked in 1500 mL of methanol/water mixture; 1:1 v/v in conical flask. The content in the flask was mixed properly by vigorous shaking for 10 min and allowed to stand for 48 h. The mixture was filtered using Whatman No. 42 filter paper. The phenolic aqueous extract (filtrate) was concentrated on a rotary evaporator (Büch Rotavapor R-200) for 12 hours at 50°C, and the residues dried in a vacuum desiccator. A 2.0 g portion of the dried extract was reconstituted in phosphate buffered saline (PBS), osmotically equivalent to 100 g/L NaCI {9.00 g NaCI, 1.71 g NaHPO.2HO and 2.43 g NaHPO.2HO/L} to give standard concentration of phenolic aqueous leaf extract. Appropriate doses of 100, 200 and 400 mg/kg body weight (bw) were administered to the experimental rats.
Total phenolic content
The total phenolic content of the extract was measured using spectrophotometric method of Nithiyanantham et al., 14 as previously reported15. The concentration of phenolic content of the extract was measured by mixing 0.1 mL of 20 mg/ mL (w/v) of the extract with 1.0 mL of 7% NaCO solutions. A 0.1 mL of Folin-Ciocalteu reagent was added to the mixture. The mixture was made up to the volume of 2.5 mL using distilled water and allowed to stand for 90 min. The absorbance of the mixture was measured at max=750 nm using a spectrophotometer. Phenolic content in milligrams of gallic acid equivalent per gram (mg GAE/g) of dry weight of the extract was measured by comparing the absorbance of the sample content with that of standard gallic acid calibration curve.
Experimental animal ethics
Healthy male Wister albino rats were obtained from the animal house of Department of Veterinary Medicine, University of Nigeria, Nsukka. The rats were acclimatized at room temperature in Abia State University animal house and were given growers mash (GM) and water ad libitum for two weeks.
The Ethical Committee for the use of animals in research, Department of Biochemistry, Federal University of Technology, Owerri, Nigeria (Ethics Approval Number: ODVC/REN/998/15) approved the present study. Handling of the rats and other experimental protocols were in accordance with the standard principles of laboratory animal care of the United States National Institutes of Health (NIH, 1978).
Induction of diabetes mellitus
The rats were fasted for 16 h, and initial fasting serum glucose concentrations (FSGC) were measured using a glucometer (Roche, Mexico City) prior to the induction of DM. Experimental DM was induced by single intra-peritoneal (i.p.) injection of 100 mg/kg bw of alloxan monohydrate (Sigma, St Loius, USA.) in PBS. The DM rats that exhibited FSGC greater than 110 mg/dL were selected for the experiment 11.
Experimental design
A total of 36 male Wister rats (Rattus norvegicus) of 8-10 weeks old, weighing between 180 and 230 g, were divided into 6 groups of 6 rats. DM-rat groups were treated by oral administration of different doses of phenolic aqueous leaf extract of V. doniana at regular intervals of 12 h for a period of 28 days. Standard anti-DM drug-dimethylguanide (Metformin™) was given to the negative control group, thus:
-
Group 1: DM-rats received GM + water
ad libitum + phenolic aqueous leaf extract ofV. doniana (100 mg/kgbw in PBS). -
Group 2: DM-rats received GM + water
ad libitum + phenolic aqueous leaf extract ofV. doniana (200 mg/kgbw in PBS). -
Group 3: DM-rats received GM + water
ad libitum + phenolic aqueous leaf extract ofV. doniana (400 mg/kgbw in PBS). -
Group 4: DM-rats received GM + water
ad libitum + dimethylguanide (500 mg/kgbw in PBS). -
Group 5: Normal rat received GM + water
ad libitum . -
Group 6: DM-rats received GM + water
ad libitum .
Body Weight
The body weight of the rats were measured on the day of commencement of treatment and on the 28 day using electronic weighing balance {Digital Precision Weighing Balance (JCS-QC03) – China}. The body weights of the rats were calculated thus:
Calculation
Where:
%∆: body weight
(b.w.): Percentage change in b.w.
b.w..AT: Body weight after treatment on day 28
b.w..BT: Body weight before treatment on day 0
Collection and preparation of blood sample
Blood samples were collected from 24 h fasted rats by cardiac puncture and allowed to clot in sterile vials. Serum samples were collected from clotted blood using a centrifuge operated at 2000 rpm for 10 min. The serum was collected by aspiration using a Pasteur pipette. The serum samples were stored in the refrigerator at 4°C prior to biochemical analyses.
Biochemical parameters
Serum glucose
Serum glucose concentration was measured using glucose oxidase method according to Randox kit instructions (Randox R Laboratories Ltd. Ardmore, United Kingdom) as previously reported 16.
Serummalondialdehyde(MDA)
Serum MDA concentration was measured according to the method of Tjahjani et al.,17 with minor modifications as previously reported18.
Serumcatalase (CAT) activity
Serum CAT activity was measured according to the methods of Luck19 as previously reported11.
Serum superoxide dismutase (SOD) activity
Serum SOD activity was measured according to the methods of Kono20 as previously reported21.
Serum glutathione (GSH) concentration
Serum GSH concentration was measured according to the methods Moron et al.,22 as previously reported23.
Serum ascorbic acid concentration
Ascorbic acid a content of the extracts was measured using iodine titrimetric methods as previously described 24.
Statistical analysis
All data obtained were expressed as mean ± standard deviation. Statistical analysis was done using one-way analysis of variance (ANOVA) and the post hoc was done using Turkey’s multiple comparison tests. The probability level was set at p < 0.05. GraphPad Prism version 7.0 software was used for all the statistical analysis.
Results
The total phenolic content of aqueous leaf extract of V. doniana was 354.00 ± 0.58 mg/ml gallic acid equivalent (GAE). At the end of the experimental time, Group 5 showed the highest percentage gain in body weight, whereas Group 6 showed loss in body weight. Figure 1 showed that the percentage gain in body weight of Group 2 was not significantly different (p > 0.05) from that of Group 1. However, the percentage gain in body weight of Group 3 was significantly different (p < 0.05) from that of Group 1. Furthermore, the percentage gain in body weight of Group 2 and Group 3 were comparable (p > 0.05). The percentage gain in body weight of the DM rat group treated with the standard anti- DM drug (Group 4) was significantly lower (p < 0.05) than that of the normal rats (Group 5), but comparable to Group 4 (p > 0.05). Group 1, Group 2 and Group 3 exhibited percentage gain in body weights that was significantly lower (p < 0.05) than Group 5 (Figure 1).

Percentage change in body weight of experimental rat groups. Treatments with superscripts a, b, c, d, e showed significant difference (p < 0.05) compared with the diabetic control rat group. Values are expressed as mean standard deviation (n = 5). Values with the same superscript are not significantly different.
Abbreviations: b.w.: Body Weight, AE: Aqueous Extracts, MET: Metformin, N: Normal, D: Diabetic.
Percentage change in body weights of experimental rat groups. Treatments with superscripts a, b, c, d, e showed significant difference (p < 0.05) compared with the diabetic control rat group. Values are expressed as mean ± standard deviation (n = 5). Values with the same superscript are not significantly different.
Abbreviations: b.w.: Body Weight, AE: Aqueous Extracts, MET: Metformin, N: Normal, D: diabetic

Serum malondialdehyde concentrations (mM/L x10-7) of experimental rat groups. Treatments with superscripts a, b, c, d, e showed significant difference (p < 0.05) compared with the diabetic control rat group. Values are expressed as mean ± standard deviation (n = 5). Values with the same superscript are not significantly different.
Abbreviations: b.w.: Body Weight, AE: Aqueous Extracts, MET: MetforminTM, N: Normal, D: diabetic
Serum superoxide dismutase (SOD) activity (IU x10-4) of experimental rat groups. Treatments with superscripts a, b, c, d, e showed significant difference (p < 0.05) compared with the diabetic control rat group. Values are expressed as mean ± standard deviation (n = 5). Values with the same superscript are not significantly different.
Abbreviations: b.w.: Body Weight, AE: Aqueous Extracts, MET: MetforminTM, N: Normal, D: diabetic
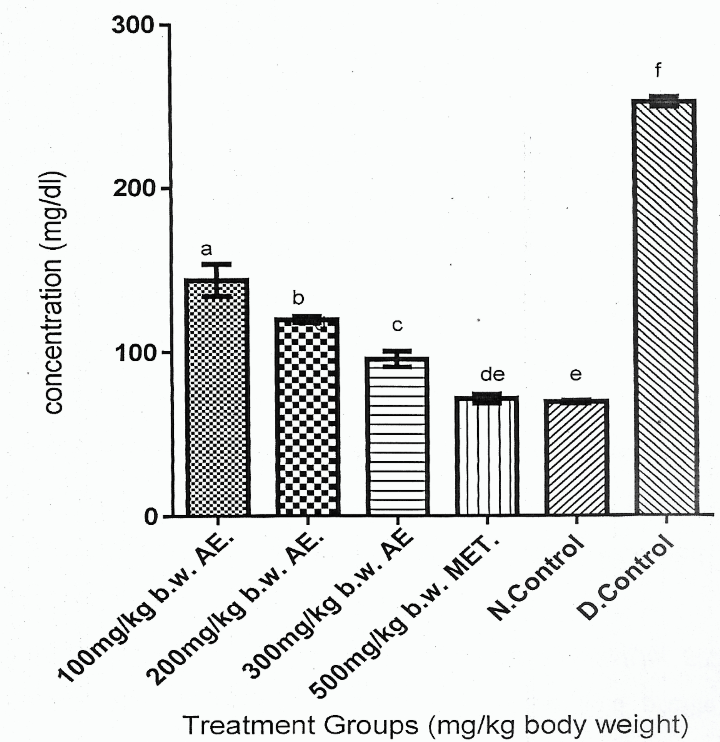
Figure 2 showed that Group 6 had the highest serum glucose concentration compared with other experimental rat groups (Groups 1-5) (p > 0.05). Figure 2 also showed that reduction in serum glucose concentrations of the DM rat groups (Group 1-3) treated with phenolic aqueous leaf extract of V. doniana was a dose dependent order, which expressed Group 3 > Group 2 > Group 1 (p < 0.05).
Figure 2 showed that Group 6 gave the highest serum glucose concentration compared to other experimental rat groups (Groups 1-5). Also, Figure 2 showed that the reduction in serum glucose concentrations of DM rats (Group 1-3) treated with phenolic aqueous leaf extract of V. doniana were a dose dependent order, as that Group 1 > Group 2 > Group 3 (p < 0.05). However, serum glucose concentrations of Groups 1-3 were significantly higher (p < 0.05) than Group 6. Finally, Figure 2 showed that serum glucose concentration of Group 5 was comparable with that of Group 6.

Serum catalase (CAT) activity (IU x10-2) of experimental rat groups. Treatments with superscripts a, b, c, d, e showed significant difference (p < 0.05) compared with the diabetic control rat group. Values are expressed as mean ± standard deviation (n = 5). Values with the same superscript are not significantly different. Abbreviations: b.w.: Body Weight, AE: Aqueous Extracts, MET: MetforminTM, N: Normal, D: diabetic
Serum MDA concentration of Group 5 was lowest compared with other experimental rat groups, whereas Group 6 gave the highest serum MDA concentration (p < 0.05) (Figure 3). Serum MDA concentration of Group 1 was not significantly reduced (p > 0.05) compared to Group 2. However, serum MDA concentration of Group 3 was significantly reduced (p < 0.05) compared with those of Group 1 and Group 2. Also, Figure 3 showed that serum MDA concentration of Group 4 was not significantly different (p > 0.05) from Group 1.

Serum glutathione (GSH) concentration (μmol/L) of experimental rat groups. Treatments with superscripts a, b, c, d, e showed significant difference (p < 0.05) compared with the diabetic control rat group. Values are expressed as mean ± standard deviation (n = 5). Values with the same superscript are not significantly different. Abbreviations: b.w.: Body Weight, AE: Aqueous Extracts, MET: MetforminTM, N: Normal, D: diabetic
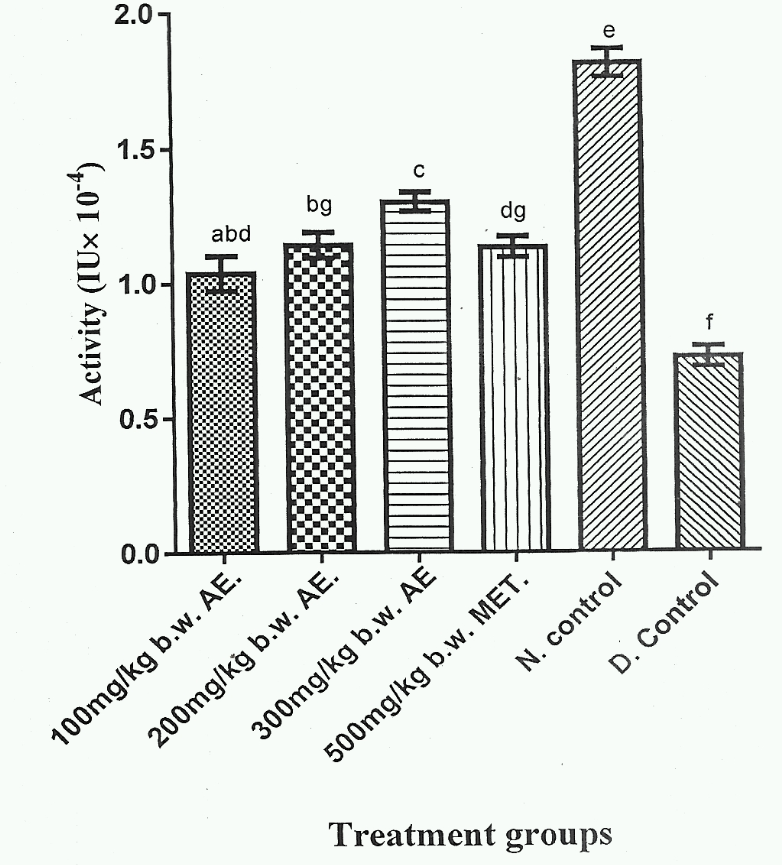
Figure 4 showed that Group 5 gave the highest serum SOD activity, whereas Group 6 exhibited the lowest serum SOD activity (p < 0.05). Additionally, serum SOD activities of Group 1, Group 2 and Group 4 were not significantly different (p > 0.05). Group 3 exhibited the highest serum SOD activity among the herbal extract treated groups (Group 1-3) and was significantly higher (p < 0;05) than Group 4, which represented DM rat group treated with standard anti- DM drug.

Serum ascorbic acid concentration (AA) concentration (μmol/L) of experimental rat groups. Treatments with superscripts a, b, c, d, e showed significant difference (p < 0.05) compared with the diabetic control rat group. Values are expressed as mean ± standard deviation (n = 5). Values with the same superscript are not significantly different.
Abbreviations:b.w.: Body Weight, AE: Aqueous Extracts, MET: MetforminTM, N: Normal, D: diabetic
Serum catalase activity was highest in Group 5 and was significantly different (p < 0.05) from other experimental rat groups (Figure 5). Serum catalase activity of herbal treated rat groups varied in an increasing order, such that Group 3 > Group 2 > Group 1, and was significantly higher (p < 0.05) than those of Group 4 and Group 6.
Figure 6 showed that serum GSH concentration of the herbal extract treated groups (Group 1-3) increased in a dose dependent manner, which expressed as Group 3 > Group 2 > Group 1 (p < 0.05). Serum GSH concentration was highest in Group 5, whereas Group 6 gave the lowest serum GSH concentration (p < 0.05).
Serum ascorbic acid concentrations of Groups 1-3 were significantly reduced (p < 0.05) compared to Group 1. However, serum ascorbic acid concentrations of Group 1, Group 2 and Group 3 were significantly higher (p < 0.05) than Group 6. Furthermore, serum ascorbic acid concentration of Group 4 was significantly higher (p > 0.05) than Group 6 but was significantly lower (p < 0.05) than those of Group 1, Group 2 and Group3 (Figure 7).
Discussion
DM is characterized by hyperglycemia as a result of impaired insulin secretion and/or action as well as alteration in carbohydrate, protein and lipid intermediary metabolism with loss in body weight25. The results of the present study showed a significant increase (p < 0.05) in the body weight of alloxan-induced DM rats administered various doses of phenolic aqueous leaf extract of V. doniana when compared with the DM control group (Figure 1). The increase in body weight observed in DM rats administered phenolic aqueous leaf extract of V. doniana was a result of the hypoglycemic action of V. doniana 26. Phenolic aqueous leaf extract of V. doniana caused increased body weight of the experimental DM rats by increasing the rate of glucose catabolism and biosynthesis of fat and protein as was previously reported27,28.
DM rats administered with various doses of phenolic aqueous leaf extract of V. doniana and dimethylguanide showed significant reduction (p < 0.05) in serum glucose concentration compared with DM control. The hypoglycemic activity of phenolic aqueous leaf extract of V. doniana was a result of its stimulatory effect on β-cells to produce insulin29, thereby enhancing glucose metabolism. Additionally, phenolic aqueous leaf extract of V. doniana might have exhibited regenerative effect on pancreatic tissue as previously reported30,31.
Oxidative injury and lipid peroxidation can be monitored by a measure of liver MDA levels. Lipid peroxidation of cellular membrane structures due to free radical activity plays an important role in aging and complications of DM5,6. Excessive levels of free radical activity cause disruption of natural antioxidant defense systems and alter antioxidant enzyme activities in tissues7. The results of this study (Figure 4) showed a significant reduction (p < 0.05) in serum MDA concentration of DM rats administered various doses of phenolic aqueous leaf extract of V. doniana. The significant reduction (p < 0.05) in serum total MDA concentration of DM rats administered various doses of phenolic aqueous leaf extract of V. doniana suggests that the extract caused reduction in the rate of lipid peroxidation.
High levels of free radicals and reduced levels of antioxidant enzyme activity lead to cell damage, inactivation of enzymes and lipid peroxidation32. The results of the present study (Figure 4,Figure 5) showed a significant increase (p < 0.05) in serum SOD and CAT activities in DM rats administered with various doses of phenolic aqueous leaf extract of V. doniana. The significant elevation (p < 0.05) in SOD and CAT activities of DM rats administered various doses of Phenolic aqueous leaf extract of V. doniana was a result of presence of phenolic compounds in the extract as previously reported33,34,35. The extract increased the rate of antioxidant enzymes activity, scavenges free radicals, and reduced the production of ROS. Yakubu et al.,36 reported that the extract reduced the production of ROS with concomitant increase in SOD activity.
Loven et al.,37 and Mishra et al.,38 reported that low levels of hepatic GSH caused reduced level of alleviation of oxidative stress in DM. The results of this study (Figure 6,Figure 7) showed a significant increase (p < 0.05) in serum GSH and ascorbic acid concentrations of DM rats administered various doses of phenolic aqueous leaf extract of V. doniana. The significant increase (p < 0.05) in GSH and ascorbic acid concentrations of DM rats administered various doses of phenolic aqueous leaf extract of V. doniana engendered the biosynthesis of GSH and/ or decreased production of free radicals, ROS and reactive nitrogen species (RNS).
Conclusion
The results of the present study indicated that phenolic aqueous leaf extract of V. doniana promoted increased body weight, ameliorated DM and alleviated reduced antioxidant activities in alloxan-induced DM rats. Therefore, phenolic aqueous leaf extract of V. doniana could serve as a potential natural and safe remedy for the management of DM and/or delay in DM complications.
Abbreviations
AA: Ascorbic acid
CAT: Catalase
DM: Diabetes mellitus
GSH: Glutathione
MDA: Malondialdehyde
PBS: Phosphate buffered saline
RNS: Reactive nitrogen species
ROS: Reactive oxygen species
SOD: Superoxide dismutase
Acknowledgement
The authors thank Professor S.C. Onyekwelu of the Department of Biology, Ebonyi State University, Abakaliki, Nigeria for technical support in the course of the experiment.
Author Contribution
Envisaged and designed the experiments: Iheanacho, K.M.E, Nwachukwu, R.N. and Agha, N.C; Extract preparation, animal study and measurement of biochemical parameters: Obasi, E.; Data analysis: Obasi, E., Chikezie, P.C.; Manuscript writing: Obasi, E., Chikezie, P.C. All authors reviewed, commented and approved the final manuscript.
Open Access
This article is distributed under the terms of the Creative Commons Attribution License (CC-BY 4.0) which permits any use, distribution, and reproduction in any medium, provided the original author(s) and the source are credited.
Competing Interests
The authors declare that no competing interests exist.