


Optimization of Human Adipose-Derived Mesenchymal Stem Cell Differentiation into Brown Adipocytes and Evaluation of Anti-Obesity Effects in an Overweight Mouse Model
- VNUHCM-US Stem Cell Institute, University of Science Ho Chi Minh City, Ho Chi Minh City, Viet Nam
- Viet Nam National University Ho Chi Minh, Ho Chi Minh City, Viet Nam
Abstract
Introduction: Brown adipose tissue (BAT) enhances energy expenditure via thermogenesis, making it a promising therapeutic target for obesity. However, adult human BAT is limited and difficult to isolate. Adipose-derived mesenchymal stem cells (ADSCs) offer an alternative source for generating functional brown adipocytes in vitro. This study aimed to optimize ADSC differentiation into brown adipocytes using rosiglitazone (a PPARγ agonist) and triiodothyronine (T3), and to evaluate their anti-obesity effects in a diet-induced overweight mouse model.
Methods: Human ADSCs were characterized for mesenchymal markers (CD73+CD90+CD105+; CD14−CD34−CD45−HLA-DR−) and multilineage differentiation potential. Brown adipogenesis was induced using varying concentrations of rosiglitazone (0–1000 nM) and T3 (0–1 nM). Differentiation was assessed by Oil Red O staining, lipolysis assays, and qPCR of UCP1, PPARγ, and PGC1α. Overweight mice (high-energy diet) were transplanted with 1 × 10⁶ differentiated brown adipocytes per mouse; body weight, BMI, and core temperature were monitored over four weeks.
Results: The combination of 1000 nM rosiglitazone and 0.2 nM T3 optimally induced brown adipocyte differentiation, evidenced by multilocular lipid droplets (versus unilocular in white adipocytes), significant upregulation of UCP1 (19-fold), PPARγ (7.5-fold), and PGC1α (3.8-fold) (p < 0.05), and decreased glycerol release (34.2 ± 0.2 nM vs. 39.9 ± 0.5 nM in controls; p < 0.0001). In overweight mice, transplantation of these brown adipocytes increased core temperature by 1.5°C (p < 0.01) and reduced body weight (by 18%) and BMI (14%) compared to PBS/white adipocyte–treated groups (p < 0.001).
Conclusion: Rosiglitazone and T3 synergistically enhance brown adipocyte differentiation in ADSCs. Transplantation of these brown adipocytes delays weight gain through thermogenesis, underscoring their potential as an anti-obesity therapy.
Introduction
Obesity has emerged as one of the most pressing global health challenges of the 21st century, with far-reaching medical, economic, and societal implications. According to the World Obesity Federation, over 2.6 billion people worldwide were living with overweight or obesity in 2020, a figure projected to surpass 4 billion by 2035—representing >50% of the global population over age 51. This worsening pandemic imposes immense economic costs, estimated at $1.96 trillion USD in 2020 alone1. Beyond its economic toll, obesity is a key risk factor for numerous life-threatening conditions, including type 2 diabetes, cardiovascular disease, hypertension, stroke, and multiple cancers2, 3. The pathophysiology connecting obesity to these comorbidities involves chronic inflammation, insulin resistance, and dysregulated lipid metabolism, highlighting the urgent need for novel therapeutic strategies that address the core imbalance between energy intake and expenditure.
Conventional approaches to obesity management—including dietary interventions, exercise programs, pharmacological agents, and bariatric surgery4, 5, 6—often produce lackluster long-term results due to low adherence, side effects, or inconsistent weight loss. This therapeutic gap has spurred interest in leveraging brown adipose tissue (BAT) as a physiological defense. Unlike white adipose tissue (WAT), which primarily stores energy as triglycerides, BAT specializes in adaptive thermogenesis—a process involving the dissipation of chemical energy as heat through mitochondrial uncoupling7, 8, 9. Central to this function is uncoupling protein 1 (UCP1), a distinct thermogenic protein abundant in brown adipocytes that separates oxidative phosphorylation from ATP synthesis, thereby boosting energy expenditure9, 10, 11. The presence of functional BAT in adult humans, once underestimated, was definitively confirmed in 2009 via PET-CT imaging12, 13. Importantly, BAT activity is inversely correlated with body mass index (BMI), suggesting its activation could mitigate obesity14. However, BAT’s natural scarcity in adults—accounting for a mere 0.1% of body mass compared to 2–5% in neonates—and its deep anatomical location (interspersed in cervical, supraclavicular, and perirenal regions) hinder direct therapeutic use15, 16.
These challenges have encouraged efforts to generate functional brown adipocytes in vitro, with adipose-derived mesenchymal stem cells (ADSCs) emerging as a promising cellular source. ADSCs offer compelling advantages: (1) They are readily found in subcutaneous adipose tissue, collectable via minimally invasive liposuction; (2) A single gram of adipose tissue can yield 3.5 × 10⁵–1 × 10⁶ cells—orders of magnitude higher than what is obtained from bone marrow aspirates17; (3) They exhibit robust proliferative capacity and maintain genetic stability in culture; and (4) They possess innate differentiation plasticity toward adipogenic lineages. Critically, ADSCs meet International Society for Cell Therapy (ISCT) criteria for mesenchymal stem cells: adherence to plastic, expression of CD73, CD90, and CD105 (>95%), absence of hematopoietic markers (CD14, CD34, CD45, HLA-DR; <2%), and trilineage differentiation potential (adipogenic, osteogenic, chondrogenic)18. These traits position ADSCs as an excellent platform for generating transplantable brown adipocytes.
The molecular pathways directing brown adipogenesis involve the coordinated activation of transcriptional regulators. PRDM16 functions as a master switch, driving brown adipocyte lineage commitment by upregulating PPARγ (peroxisome proliferator-activated receptor gamma) and its coactivator PGC1α (PPARγ coactivator 1-alpha)19, 20. PPARγ—the "master regulator of adipogenesis"—induces genes essential for lipid storage and adipocyte maturation when activated by ligands like rosiglitazone, a thiazolidinedione (TZD)21. Meanwhile, PGC1α controls mitochondrial biogenesis and UCP1 expression, while thyroid hormone triiodothyronine (T3) further amplifies thermogenesis through nuclear receptor-mediated gene regulation22, 23, 24. Although rosiglitazone and T3 each support brown adipocyte characteristics, their synergistic potential is still underexamined. Rosiglitazone augments PPARγ-dependent transcription of PRDM16 and UCP1, while T3 enhances UCP1 proteolytic stability and PGC1α activity24, 25. Fine-tuning their combined dosing could thus maximize thermogenic output—a hypothesis central to this investigation.
Despite promising in vitro differentiation protocols26, 27, 28, significant gaps remain: 1) Protocol standardization: current methods employ a wide range of rosiglitazone concentrations (20–1000 nM) and T3 levels (0.2–2.3 nM), with no consensus regarding their optimal synergy. 2) Functional validation: most studies focus solely on UCP1 expression, overlooking integrated markers like lipolysis suppression—a key feature of BAT’s lipid-retentive metabolism. 3) Therapeutic efficacy: few investigations measure the metabolic effects of transplanted brown adipocytes in relevant obesity models29, 30.
To bridge these deficiencies, we established two main objectives: (1) refine a combinatorial protocol for differentiating human ADSCs into functional brown adipocytes by screening rosiglitazone (0–1000 nM) and T3 (0–1 nM) concentrations, evaluating success based on cellular morphology (multilocular lipid droplets), thermogenic gene expression (UCP1, PPARγ, PGC1α), and lipolytic activity; and (2) demonstrate anti-obesity efficacy in a diet-induced overweight mouse model by transplanting the optimized brown adipocytes and measuring changes in body weight, BMI, and thermogenesis. This study offers a robust protocol for generating therapeutically active brown adipocytes and provides preclinical evidence for their potential application in obesity treatment.
Methods
Cell Culture and Characterization
Human adipose-derived mesenchymal stem cells (ADSCs) were obtained from lipoaspirates provided by the Biobank, Stem Cell Institute (University of Science, VNU-HCMC, VN). Cells were cultured in ADSCCult I medium (Regenmedlab, VN) and maintained at 37°C with 5% CO. Routine passaging involved enzymatic detachment using Deattachment reagent, centrifugation (500 × g, 5 min), and reseeding in T25/T75 flasks. For cryopreservation, cells were suspended in CryoSave I medium (Regenmedlab, VN), cooled sequentially (4°C for 30 min, −20°C for 1–2 hr), and stored at −86°C. Thawing utilized rapid rewarming (37°C water bath), dilution in Thawbest medium (Regenmedlab, VN), and centrifugation (300 × g, 5 min). ADSC identity was validated via flow cytometry (BD FACSCalibur, US) confirming CD44, CD73, CD90, and CD105 positivity (>95%) and CD14, CD34, CD45, and HLA-DR negativity (<2%). Trilineage differentiation potential was assessed using commercial kits: adipogenesis (Oil Red O staining, day 7), osteogenesis (Alizarin Red S staining, day 21), and chondrogenesis (Alcian Blue staining, day 14) All chemicals and media were purchased from Regenmedlab (Ho Chi Minh City, Viet Nam).
Brown Adipocyte Differentiation
Differentiation was induced using a two-phase protocol. Cells were pre-treated for 3 days with StemPro Adipogenesis Differentiation Kit to initiate adipogenesis (Gibco, ThermoFisher scientific, US). Subsequently, 12 experimental groups were exposed to combinatorial treatments of rosiglitazone (0, 100, 500, or 1000 nM; BioGems International, CA) and triiodothyronine (T3; 0, 0.2, or 1 nM; Sigma-Aldrich, Louis St, MO) for 21 days. Morphological changes were tracked via Oil Red O (Sigma-Aldrich, Louis St, MO) staining on days 3, 7, 14, and 21 using a Zeiss inverted microscope.
Combinations of Rosiglitazone and T3 to induce ADSCs toward to brown adipocytes
|
Combinations |
(1) |
(2) |
(3) |
(4) |
(5) |
(6) |
(7) |
(8) |
(9) |
(10) |
(11) |
(12) |
|
Rosiglitazone (nM) |
- |
100 |
500 |
1000 |
- |
100 |
500 |
1000 |
- |
100 |
500 |
1000 |
|
T3 (nM) |
- |
- |
- |
- |
0.2 |
0.2 |
0.2 |
0.2 |
1.0 |
1.0 |
1.0 |
1.0 |
Molecular and Functional Assessment
Total RNA was extracted using the easy-BLUE Total RNA Kit (iNtRON Biotech, Korea) with chloroform/isopropanol purification. Gene expression of UCP1, PPARγ, and PGC1α (normalized to GAPDH) was quantified via one-step RT-qPCR (Luna Universal Kit; New England Biolabs, MA) on Eppendorf Realplex cycler (Eppendorf, Germany). Primer sequences were as follows: UCP1: F 5′-AGTTCCTCACCGCAGGGAAAGA-3′, R 5′-GTAGCGAGGTTTGATTCCGTGG-3′; PPARγ: F 5′-AGCCTGCGAAAGCCTTTTGGTG-3′, R 5′-GGCTTCACATTCAGCAAACCTGG-3′; PGC1α: F 5′-CCAAAGGATGCGCTCTCGTTCA-3′, R 5′-CGGTGTCTGTAGTGGCTTGACT-3′.
Functional lipolysis was assessed by measuring glycerol release after 18 hr isoproterenol stimulation (100 nM; Lipolysis Assay Kit, Abcam), with absorbance read at 570 nm (Beckman Coulter DTX 880 plate reader).
Animal Studies
All procedures were performed in accordance with institutional guidelines and approved by the institutional ethics committee. Male BALB/c mice (6 weeks old; n = 30) were acclimatized for 2 weeks before being divided into two dietary groups: a control diet comprising standard chow (18% protein, 5% lipid) and a high-energy diet consisting of 70% standard chow plus 30% lipid-rich seeds (sunflower/peanut/macadamia).
After following their respective diets for 40 days, overweight mice were randomly assigned to one of three transplant groups (n = 5/group):
-
Control (PBS) group: subcutaneous injection of 100 µL PBS.
-
White adipocyte group: subcutaneous injection of 1 × 10⁶ white adipocytes suspended in 100 µL PBS.
-
Brown adipocyte group: subcutaneous injection of 1 × 10⁶ brown adipocytes suspended in 100 µL PBS. Brown adipocytes were induced with 1000 nM rosiglitazone and 0.2 nM T₃.
Cells were injected subcutaneously in the abdominal region using a 25–30° needle angle. Body weight (Fisher Scientific CLF201 scale), naso-anal length, and BMI [weight (g)/length² (cm²)] were monitored weekly. Thermogenesis was assessed via infrared thermometry (iMediCare iTM-9S) at abdominal and ear sites on days 0, 1, 2, 3, 7, 11, 14, 18, 21, 25, and 28.
Statistical Analysis
Data are presented as mean ± SD. Differences between groups were analyzed using two-tailed Student’s t-tests or ANOVA in GraphPad Prism 8, with significance at p < 0.05.
Results
Characterization of Human ADSCs
Isolated adipose-derived mesenchymal stem cells (ADSCs) exhibited typical fibroblast-like morphology, adhering to plastic surfaces with elongated spindle shapes (Figure 1A). Flow cytometry confirmed expression of mesenchymal surface markers CD44 (98.65 ± 1.68%), CD73 (98.67 ± 1.04%), CD90 (99.68 ± 0.33%), and CD105 (99.11 ± 0.55%), while lacking hematopoietic markers CD14 (0.06 ± 0.05%), CD34 (0.04 ± 0.05%), CD45 (0%), and HLA-DR (0.003 ± 0.005%) (Figure 1B). Trilineage differentiation assays revealed robust multipotency: adipogenic induction produced lipid-laden cells staining positive with Oil Red O (Figure 1C), osteogenic differentiation induced mineralized matrix deposition (Alizarin Red S; Figure 1D), and chondrogenesis generated proteoglycan-rich aggregates (Alcian Blue; Figure 1E), confirming compliance with ISCT criteria.
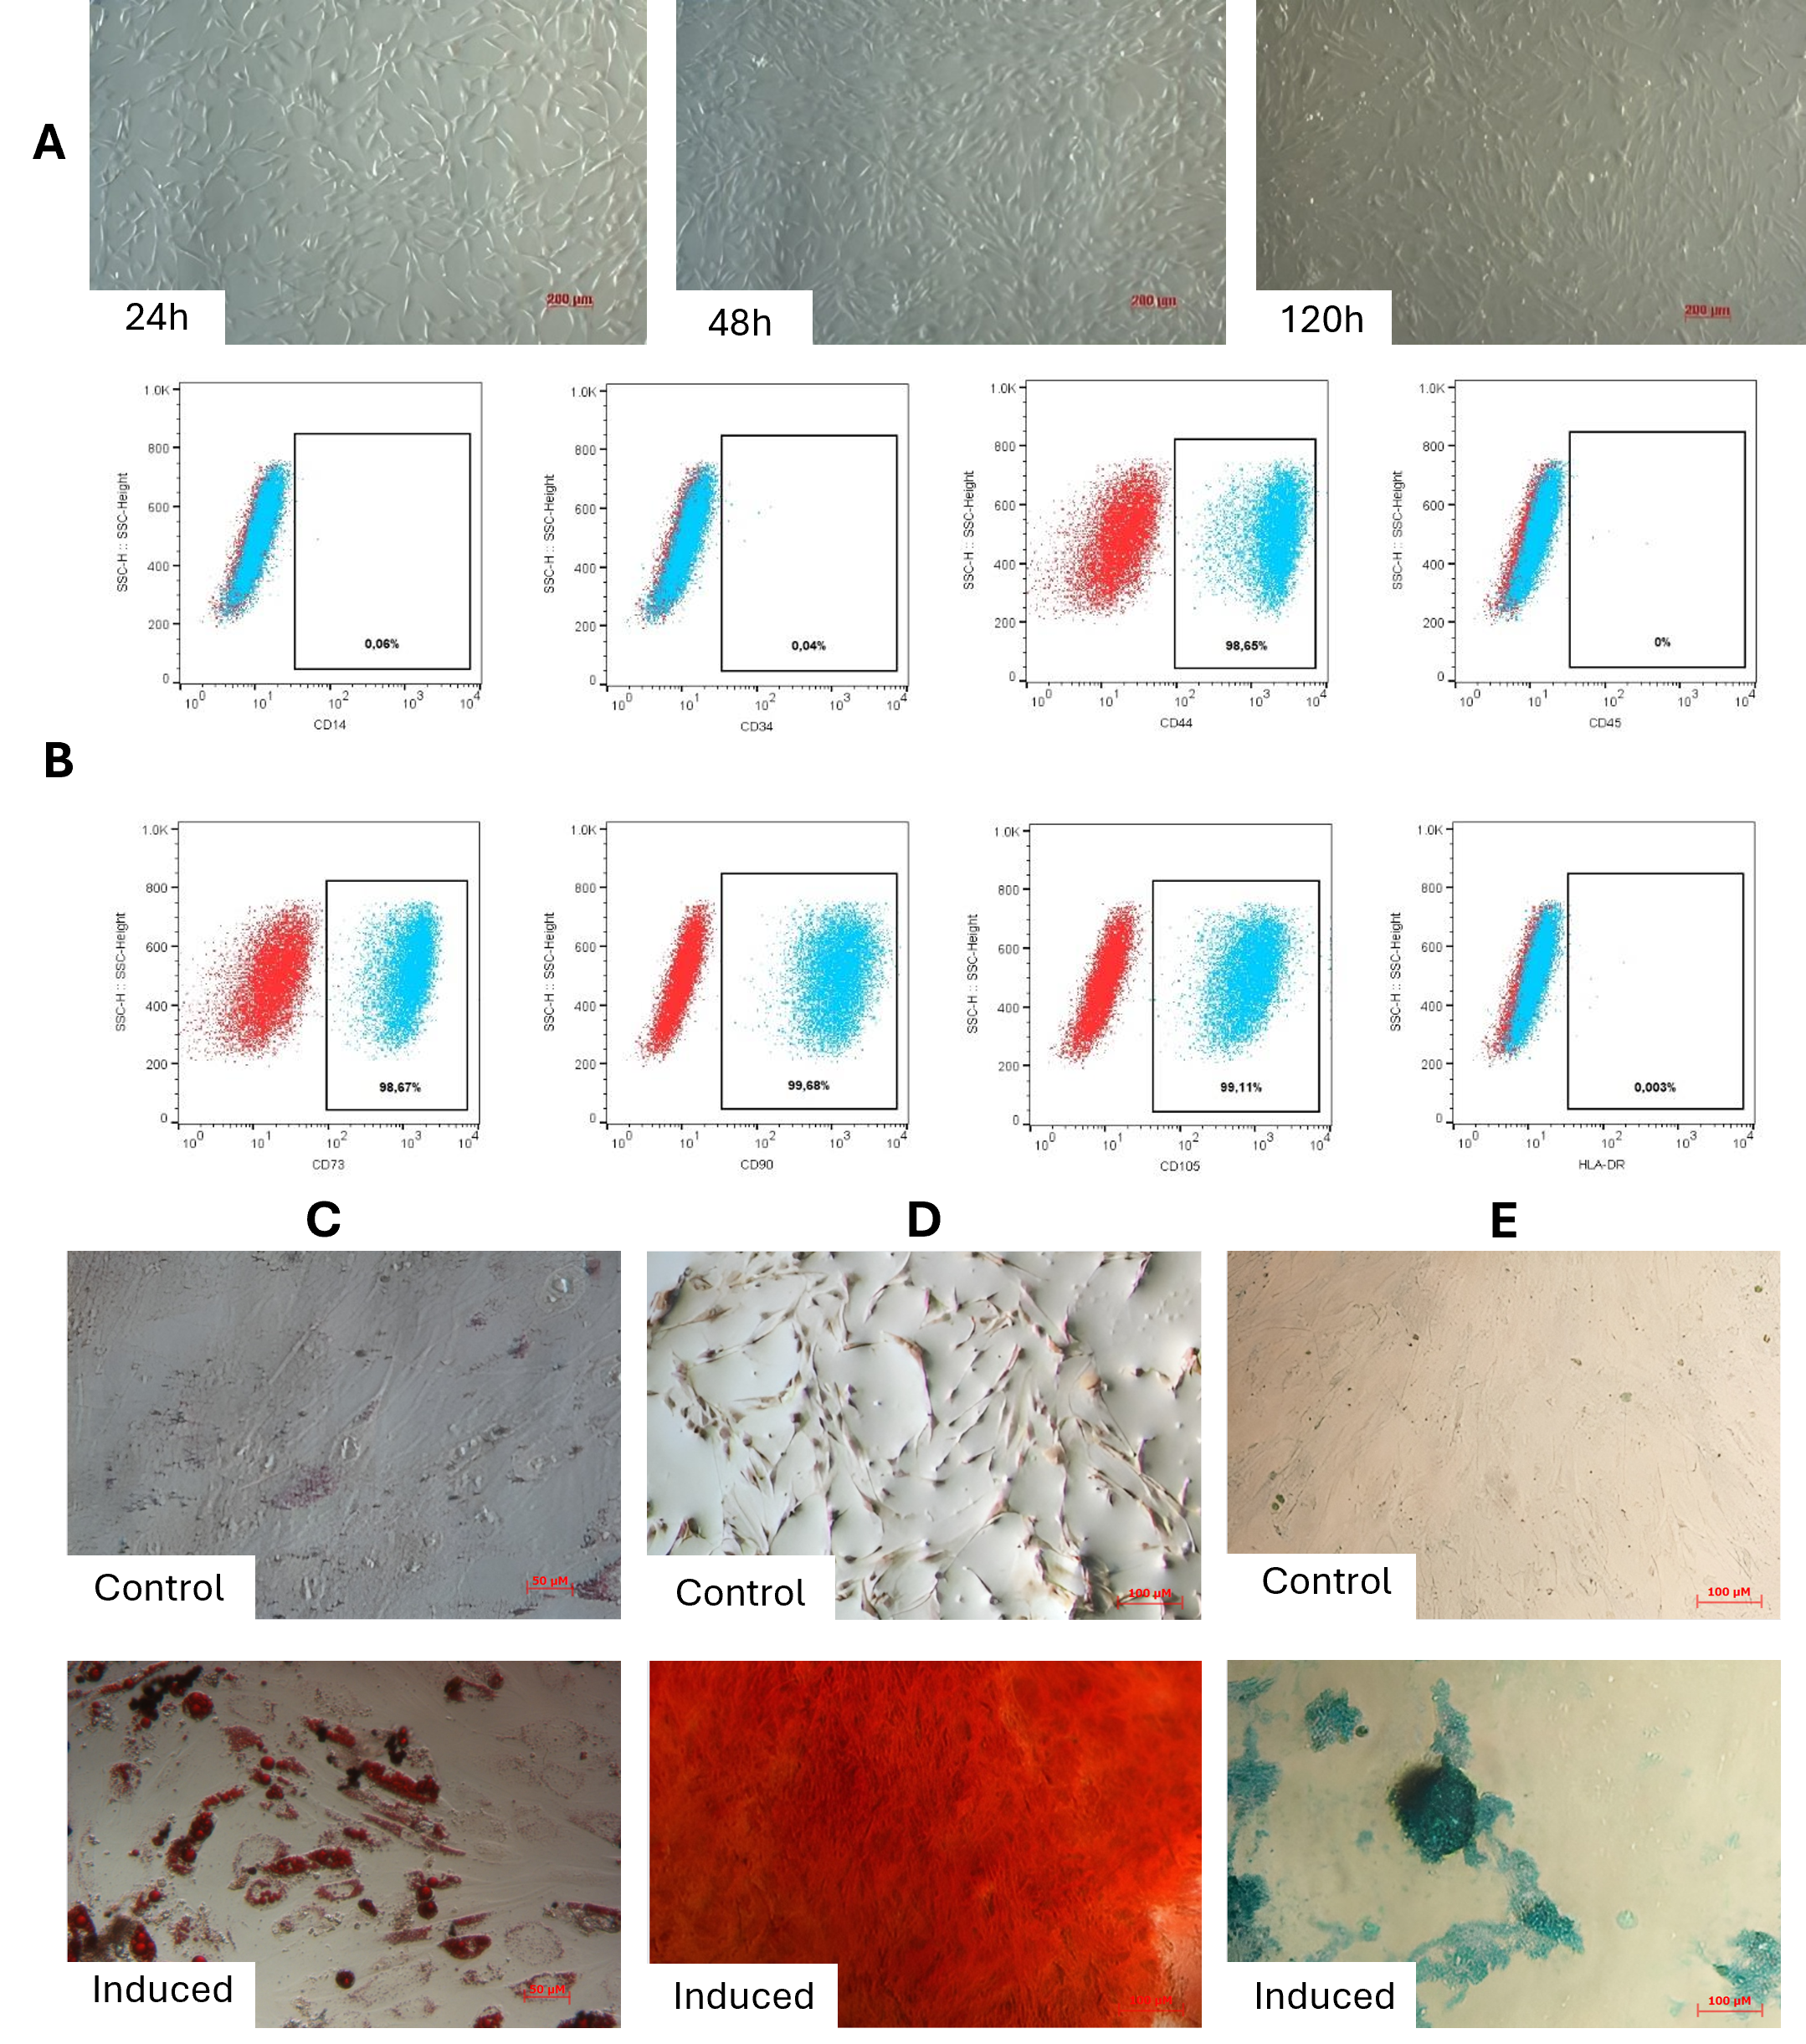
Characterization of adipose-derived mesenchymal stem cells (ADSCs). (A) Phase-contrast micrograph showing adherent ADSCs with typical fibroblast-like, spindle-shaped morphology. (B) Flow cytometry analysis confirming expression of mesenchymal markers (CD44, CD73, CD90, CD105) and absence of hematopoietic markers (CD14, CD34, CD45, HLA-DR). Data represent mean percentage ± SD. (C) Adipogenic differentiation: Lipid accumulation visualized by Oil Red O staining in induced cells. (D) Osteogenic differentiation: Mineralized matrix deposition detected by Alizarin Red S staining in induced cells. (E) Chondrogenic differentiation: Proteoglycan-rich aggregates stained with Alcian Blue in induced cells at 24h, 48h, and 120h. Results demonstrate compliance with ISCT criteria for multipotent mesenchymal stem cells. Scale bars: 200 μm (A, C-E).
Morphological Changes During Brown Adipogenesis
Combinatorial treatment with rosiglitazone and T3 induced distinct morphological shifts. By day 7, cells exposed to rosiglitazone (≥ 500 nM) and T3 (≥ 0.2 nM) developed multilocular lipid droplets, contrasting with unilocular droplets in controls (rosiglitazone/T3-free). This phenotype intensified by day 21, where the 1000 nM rosiglitazone + 0.2 nM T3 group showed the highest proportion of cells with small, multilocular droplets (Figure 2). Time-lapse imaging revealed progressive lipid accumulation: nascent droplets appeared by day 3, expanded through day 14, and achieved mature morphology by day 21. Oil Red O staining confirmed lipid retention in all groups, but multilocularity was exclusive to rosiglitazone/T3-treated cells (Figure 3).
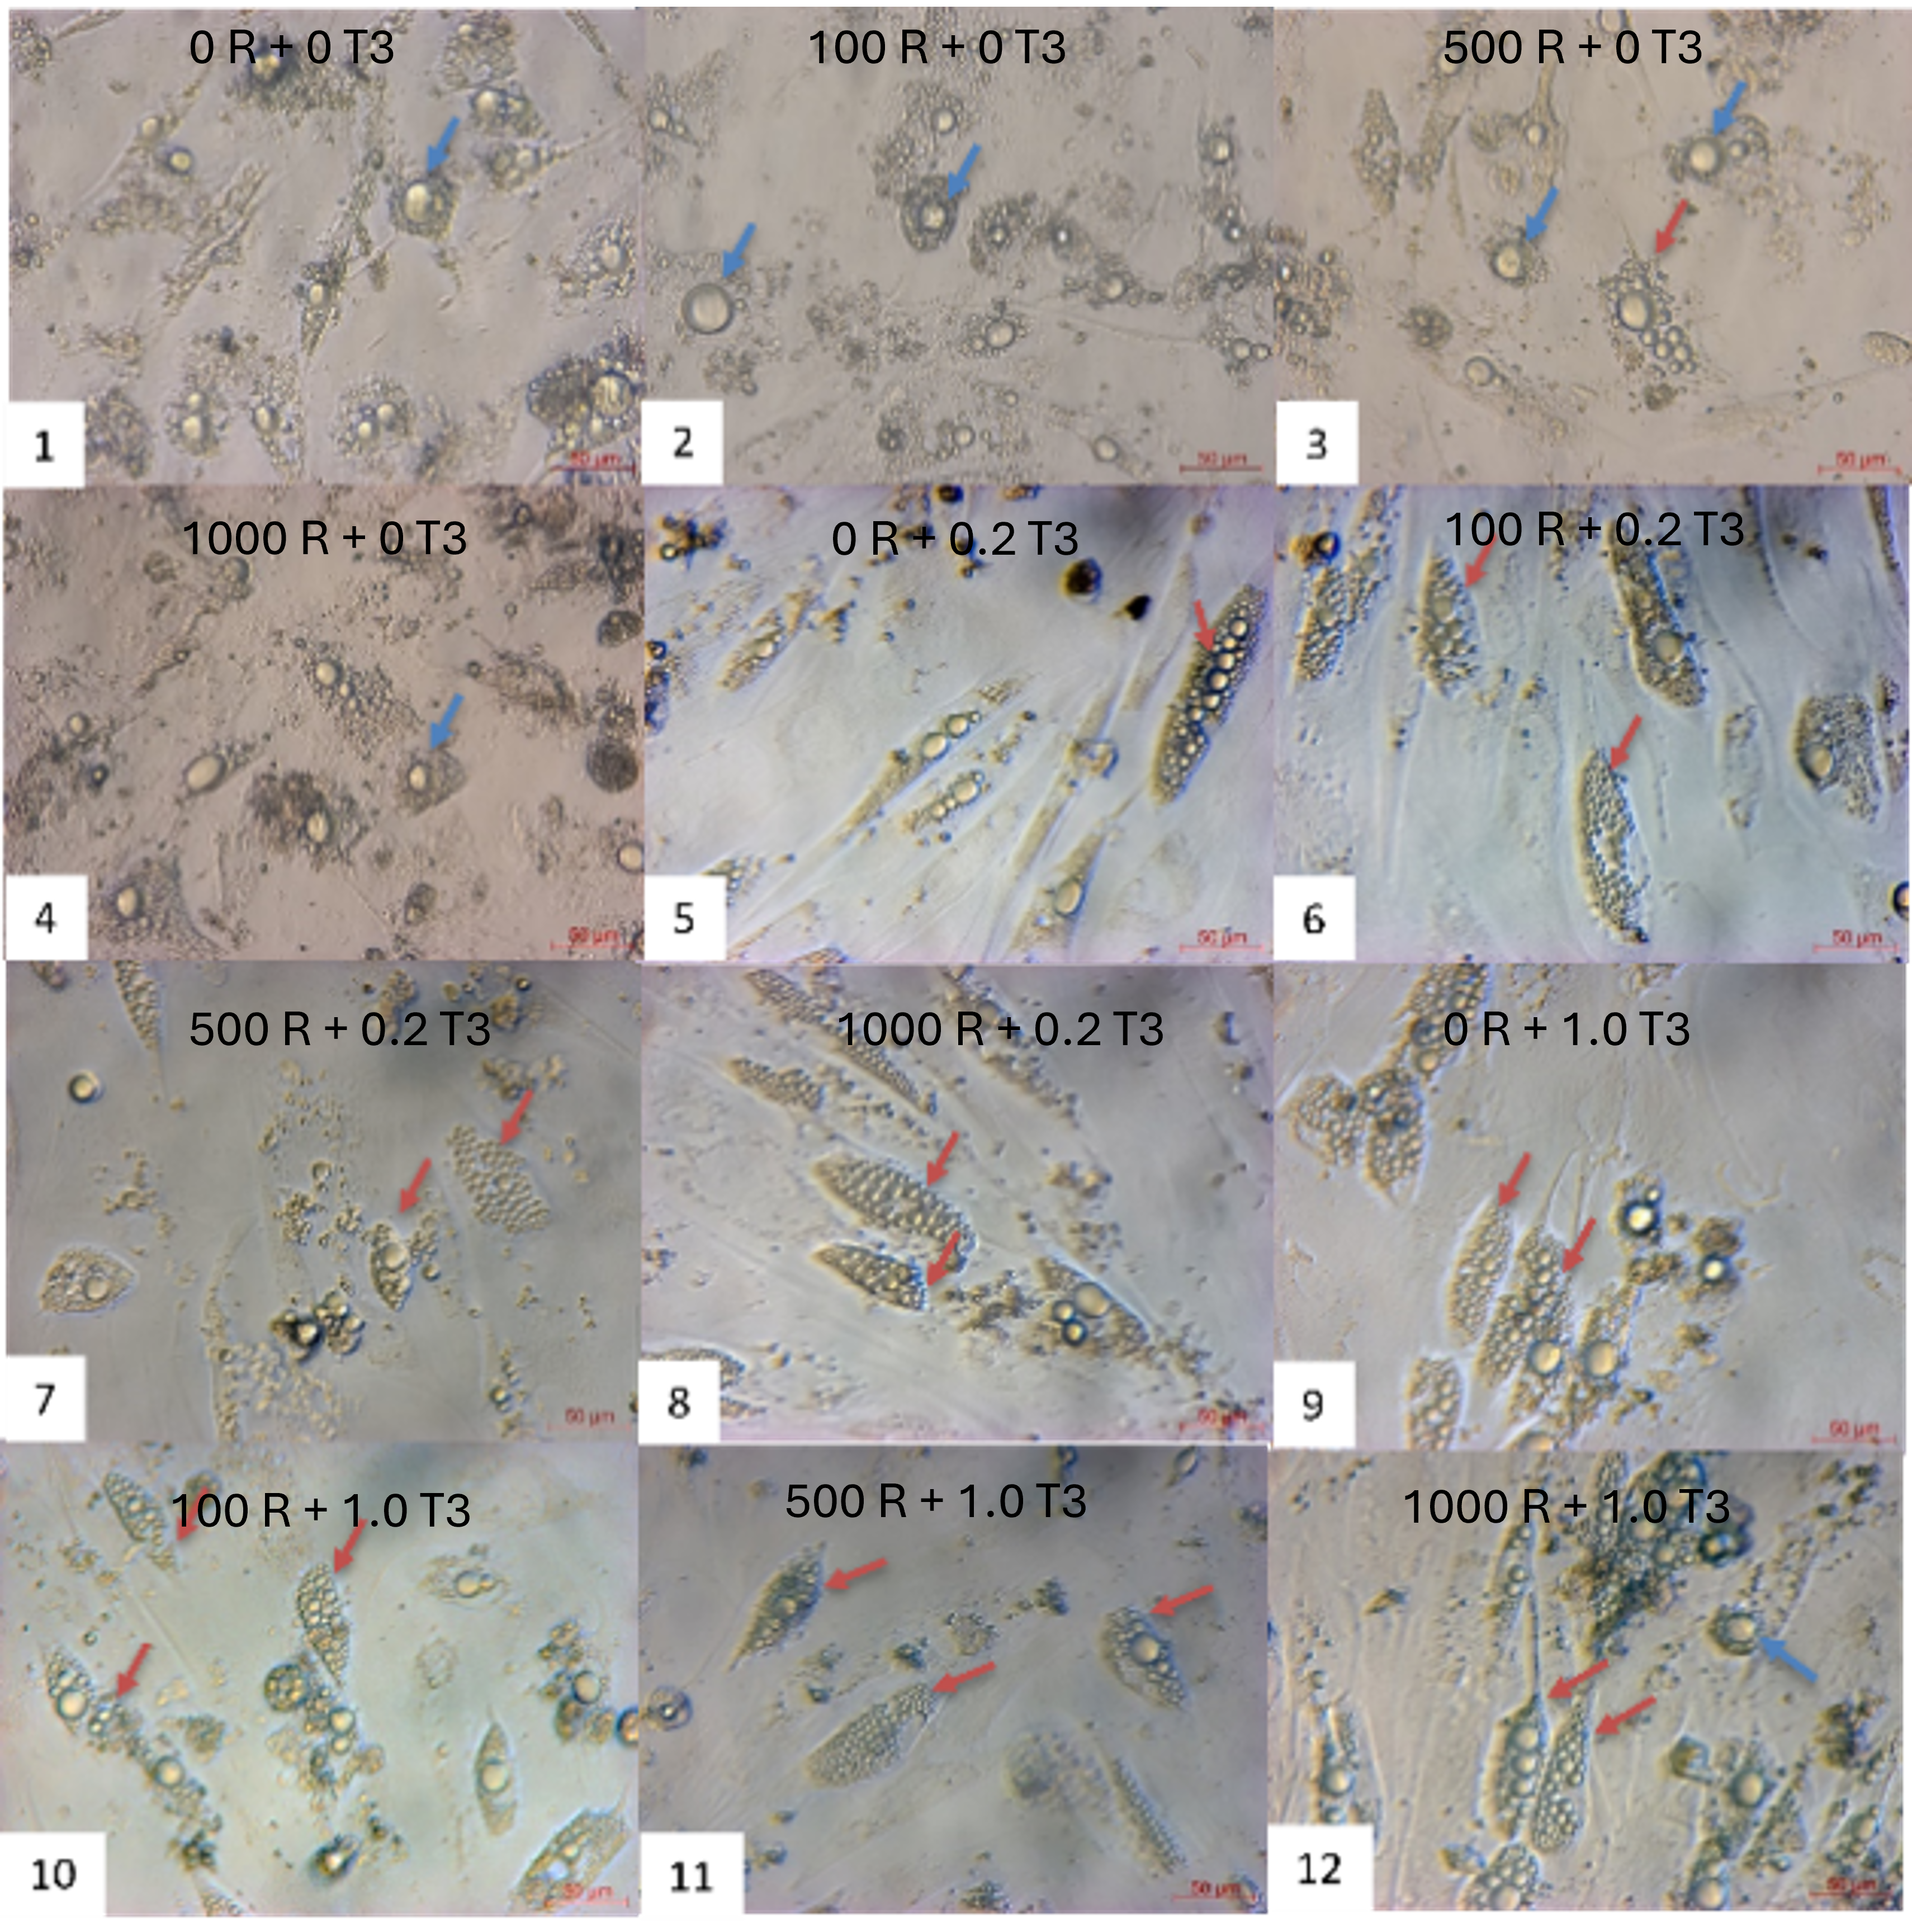
Morphological changes of ADSCs during brown adipogenesis in different combinations of rosiglitazone and T3. The oil doplets appeared in all combinations of rosiglitazone and T3. The combination of (1) as control (without rosiglitazone and T3), the ADSCs are induced into white adipocytes.
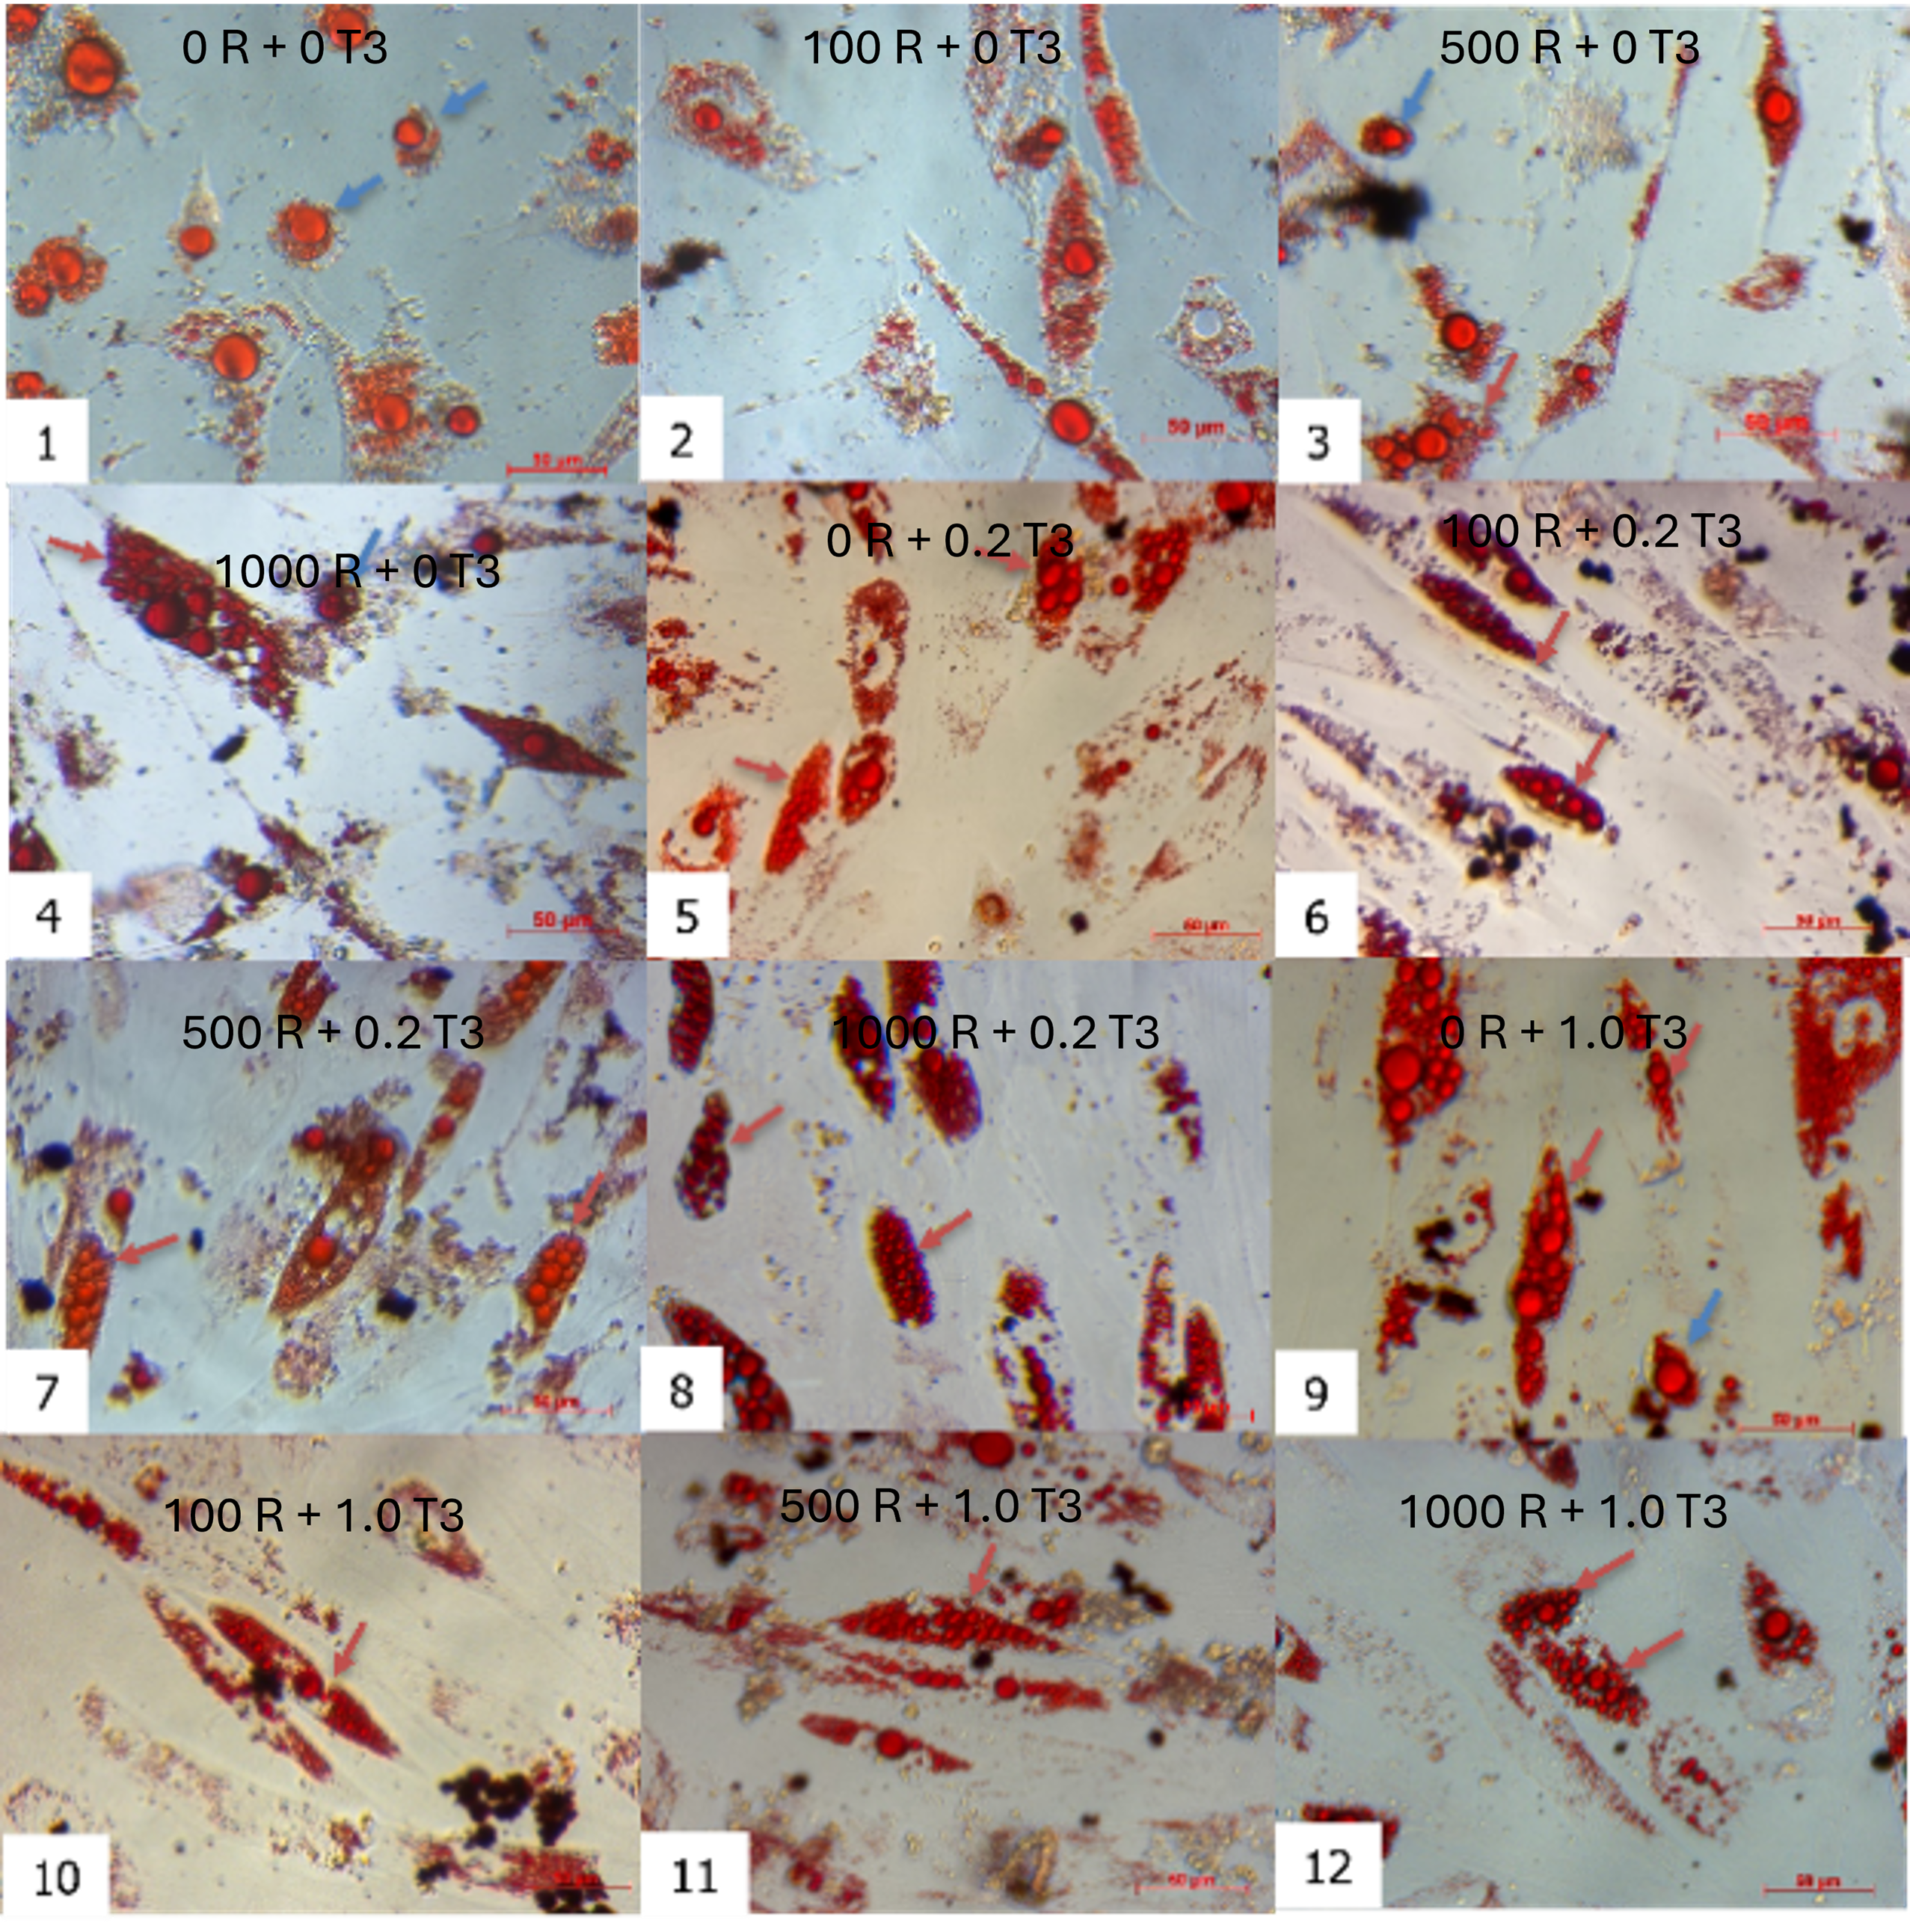
Oil Red staining of induced ADSCs toward adipocytes after 21 days. The oil doplets appeared in all combinations of rosiglitazone and T3 with red color. The combination of (1) as control (without rosiglitazone and T3), the ADSCs are induced into white adipocytes.
Thermogenic Gene Expression
qPCR analysis demonstrated dose-dependent upregulation of brown adipocyte markers:
UCP1: The 1000 nM rosiglitazone + 0.2 nM T3 protocol maximally induced UCP1 (19-fold vs. control; p < 0.001) in donor 1 cells (Figure 4A). While donor variability existed (e.g., 4.9-fold increase in donor 2 with 500 nM rosiglitazone + 0.2 nM T3), the 1000 nM rosiglitazone + 0.2 nM T3 combination consistently outperformed single-agent treatments across donors (p < 0.05).
PPARγ: Expression peaked at 7.48-fold (p < 0.001) under 1000 nM rosiglitazone + 0.2 nM T3 (donor 1), with significant synergy versus rosiglitazone alone (Figure 4B).
PGC1α: The same protocol elevated PGC1α 3.84-fold (p < 0.05) in donor 1 cells, corroborated in donors 2 (3.62-fold) and 3 (3.32-fold) (Figure 4C).
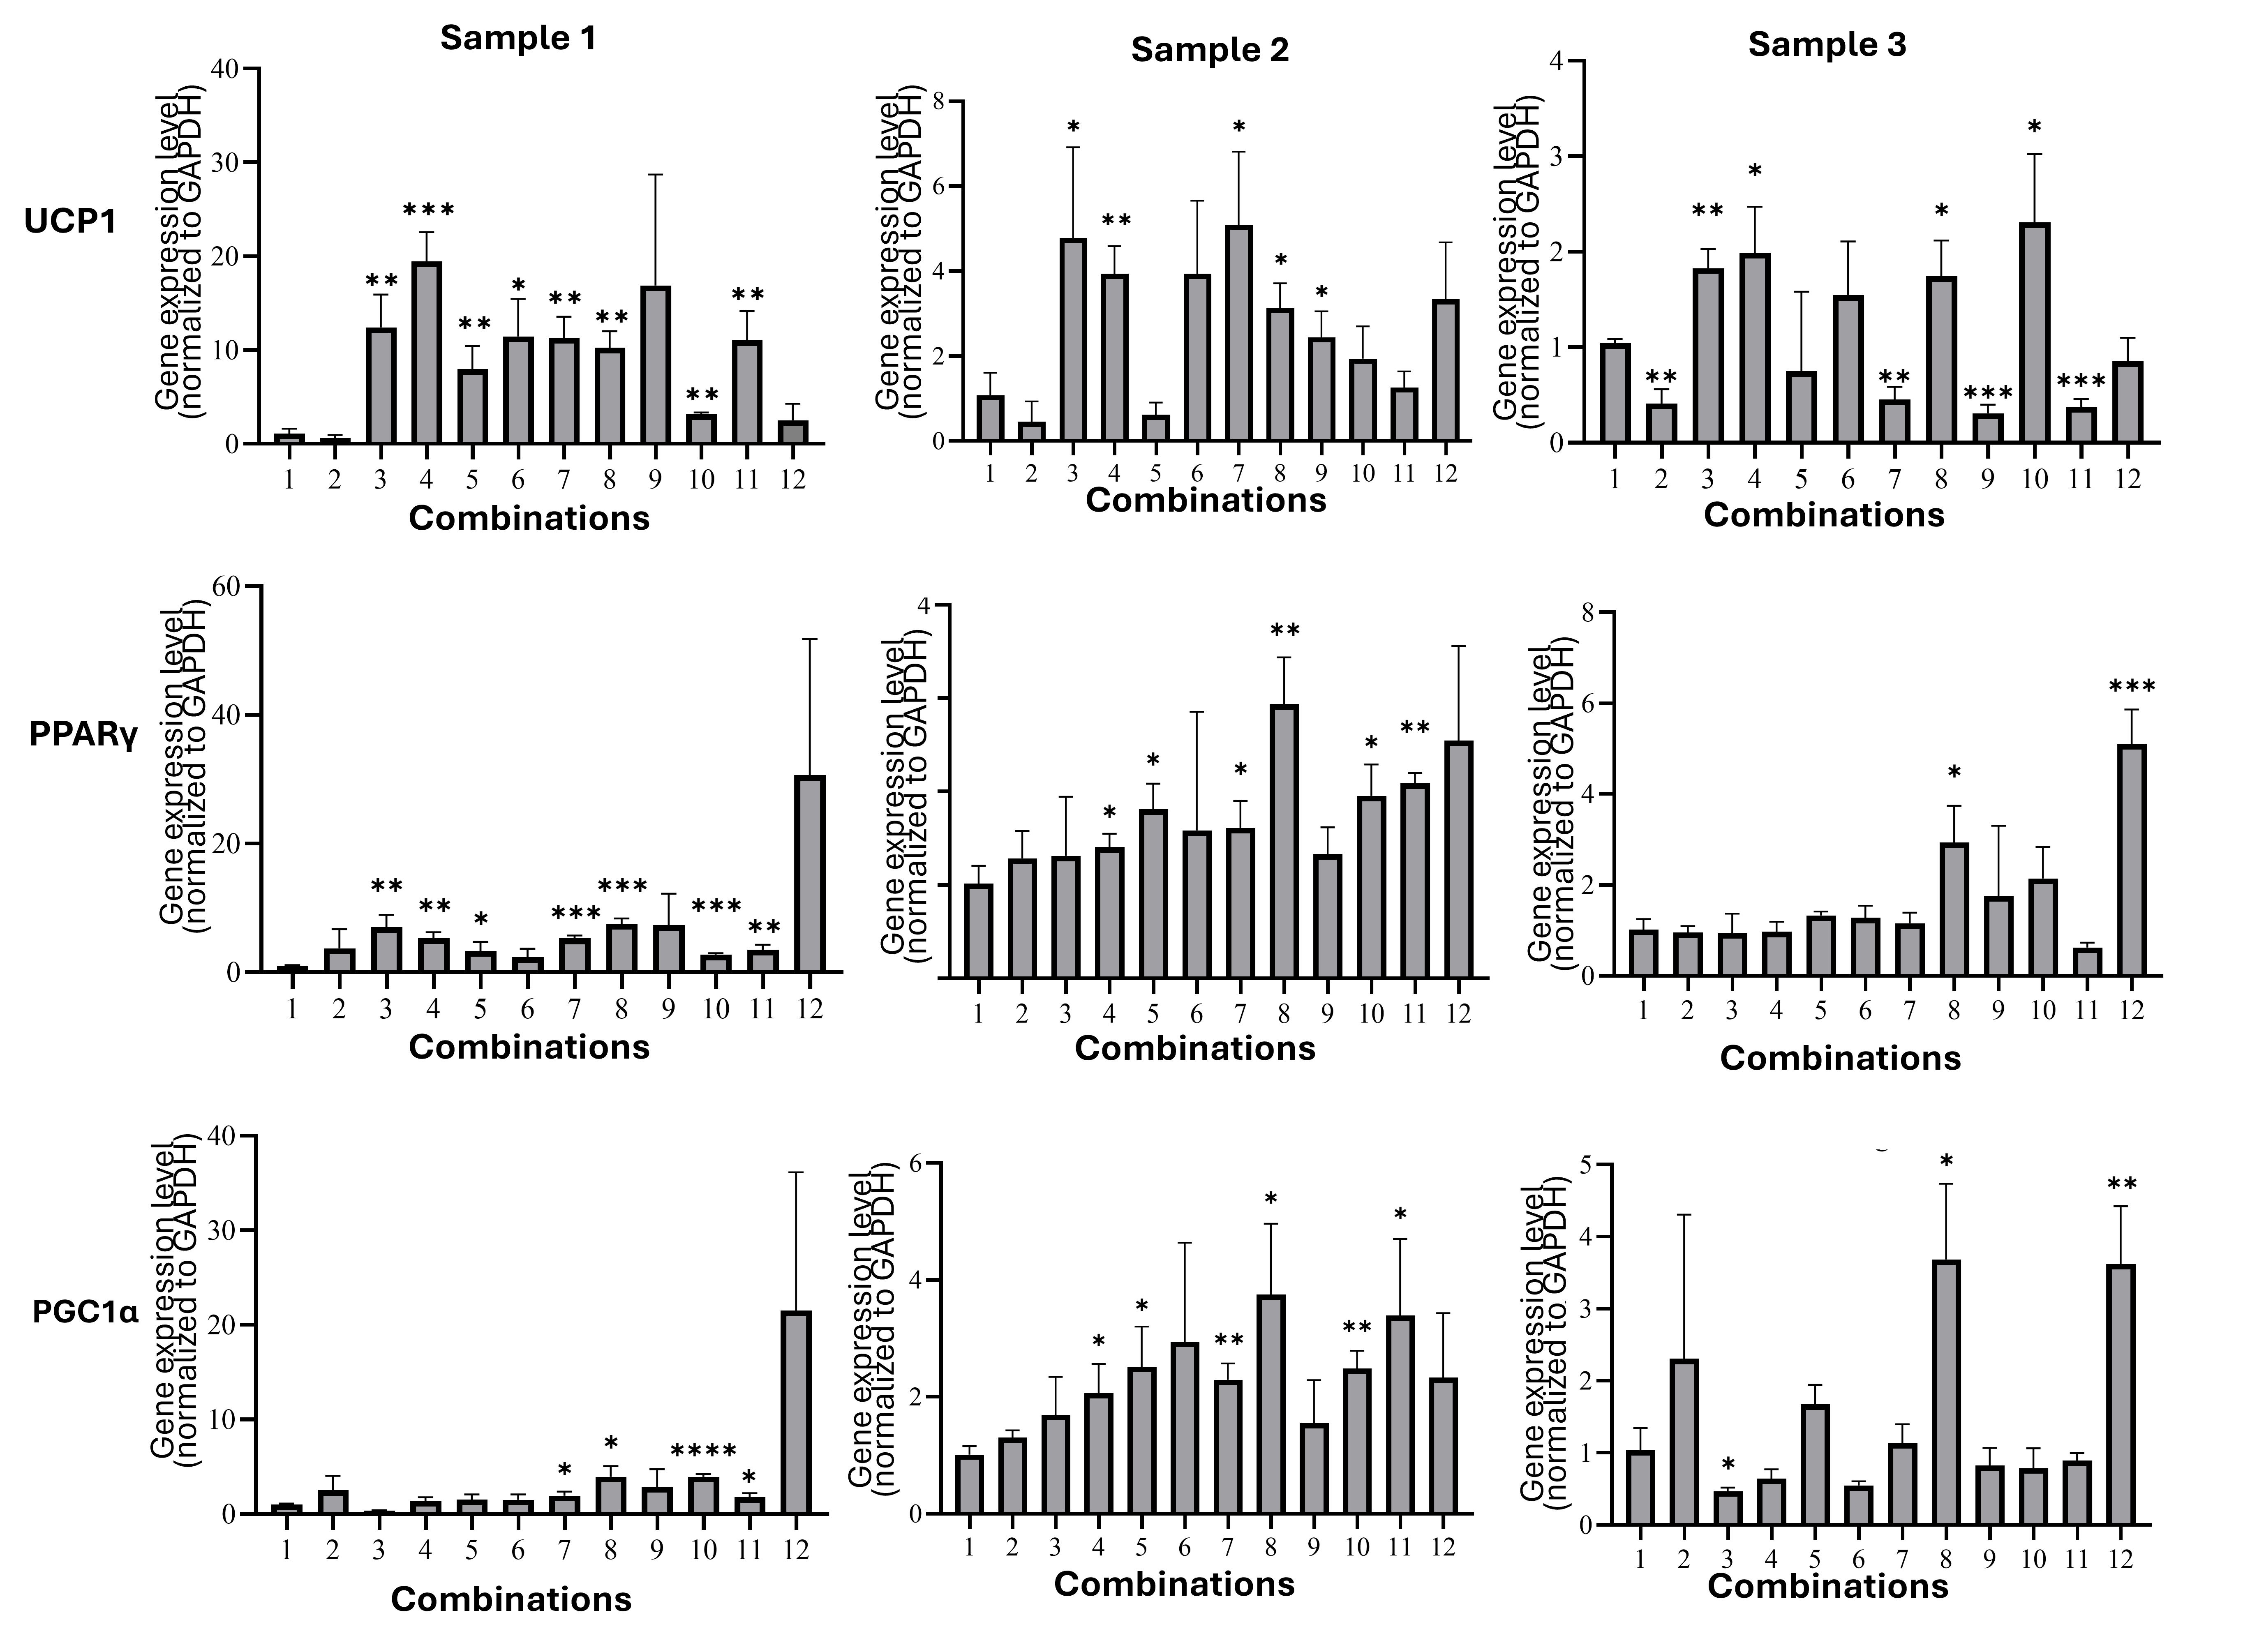
Thermogenic gene expression in adipocytes of all combinations. (A) UCP1: The 1000 nM rosiglitazone + 0.2 nM T3 protocol maximally induced
Lipolytic Activity
Differentiated brown adipocytes exhibited suppressed lipolysis, reflecting their metabolic reprogramming for lipid retention. The 1000 nM rosiglitazone + 0.2 nM T3 group released only 34.19 ± 0.17 nM glycerol versus 39.85 ± 0.52 nM in controls (p < 0.0001; Figure 5). This reduction was consistent across donors and correlated with multilocular morphology, confirming functional maturation.
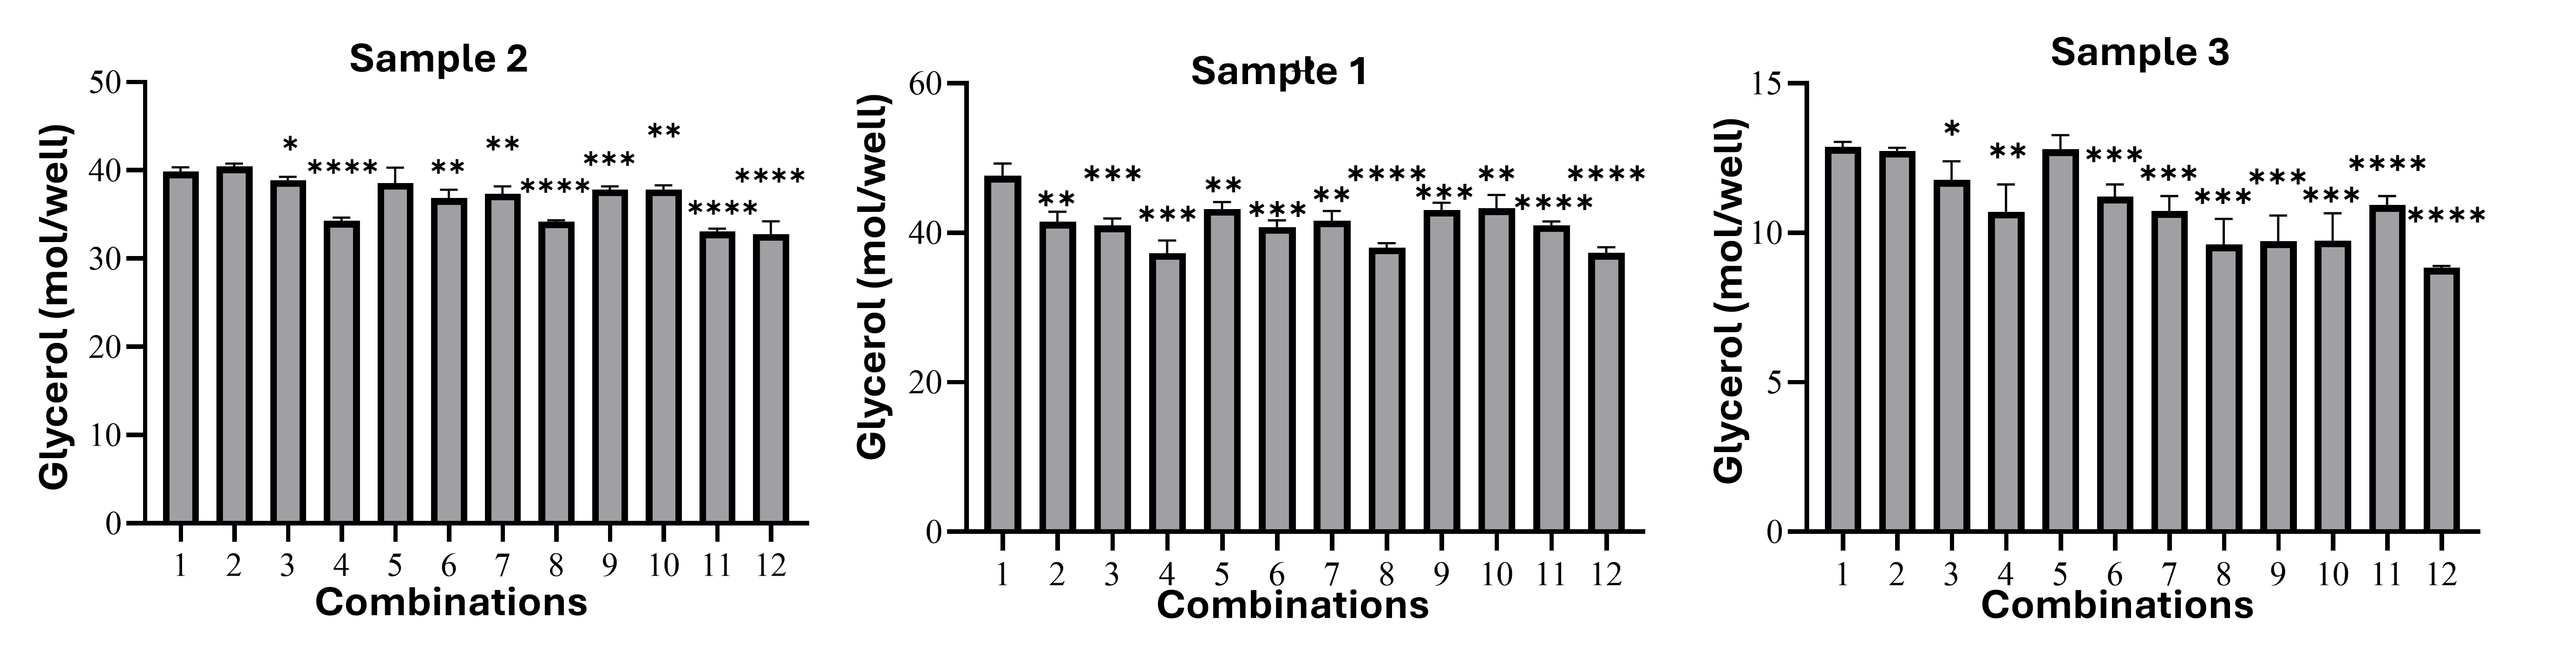
Lipolytic activity of brown adipocytes. Differentiated brown adipocytes exhibited suppressed lipolysis, reflecting their metabolic reprogramming for lipid retention. The 1000 nM rosiglitazone + 0.2 nM T3 group released only 34.19 ± 0.17 nM glycerol versus 39.85 ± 0.52 nM in controls (p < 0.0001). *Data presented as mean ± SD; statistical significance: *p* < 0.05, **p* < 0.01, *
Diet-Induced Overweight Model
Mice fed a high-energy diet for 40 days showed significant weight gain (31.58 ± 1.0 g (in model mice) vs. 26.12 ± 1.4 g in controls (normal mice); p < 0.0001) and elevated BMI (0.35 ± 0.015 (in model mice) vs. 0.29 ± 0.004 (normal mice); p < 0.0001), validating successful obesity induction (Figure 6A,B).
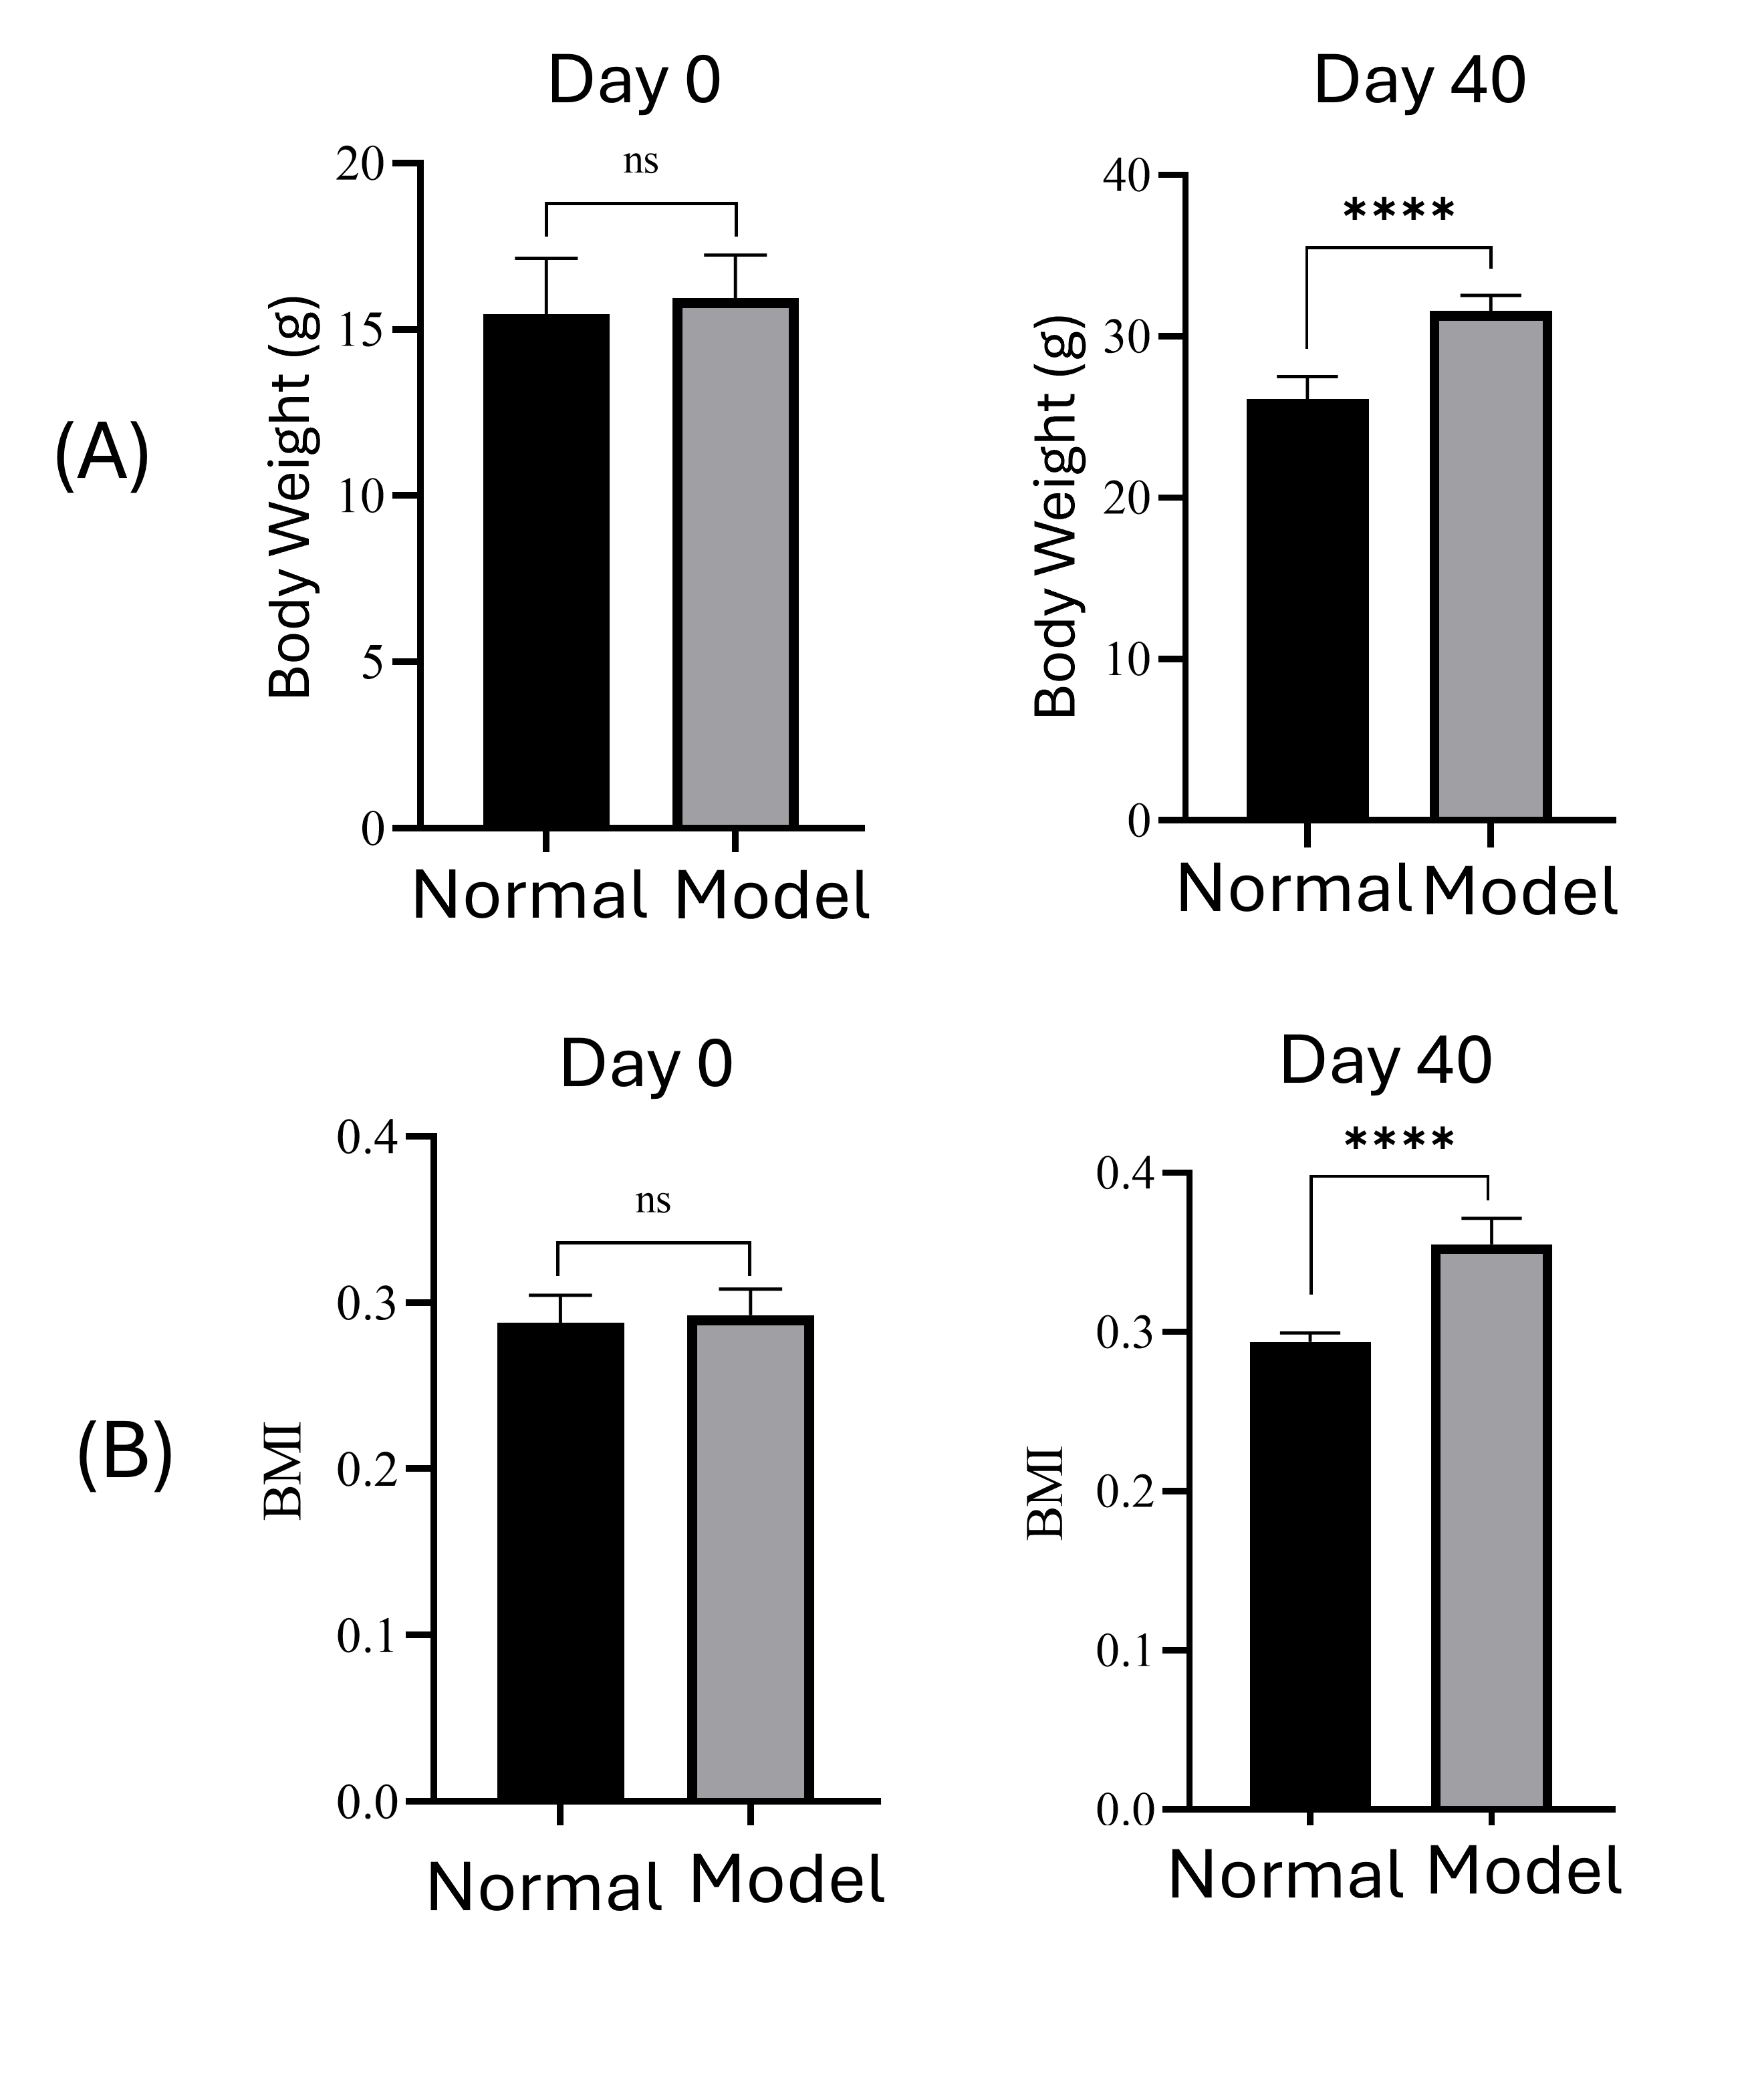
Diet-induced overweight model. After 40 days of feeding with a high-energy diet, mice in the model group (model) significantly gained body weight (A) and BMI (B).
Anti-Obesity Effects of Transplanted Brown Adipocytes
Effect on Increasing Body Temperature
The abdominal skin temperature measurements are shown in Figure 7A. Prior to transplantation, mice in all three groups had similar abdominal skin temperatures (36.62–36.68°C). Over the first three days post-transplantation, the body temperature of mice receiving either white adipose cells (WAC) or brown adipose cells (BAC) increased significantly. In the WAC group, temperature peaked at 37.83°C on Day 1 and reached a lower peak (37.59°C) on Day 3. On Day 7, the WAC group’s temperature dropped sharply (36.57°C), whereas the BAC group maintained a significantly higher value (37.51°C; p ≤ 0.001). From Day 11 onward, WAC-group temperatures stabilized between 36.63 and 36.72°C. BAC-group temperatures gradually decreased until Day 18 (36.77°C, p > 0.05), then remained stable. In the PBS-injected control group, temperatures rose during the first three days—though less markedly than in the cell-transplanted groups—and reached a maximum of 37.21°C on Day 1. From Day 7 onward, this group maintained abdominal skin temperatures between 36.62 and 36.75°C.
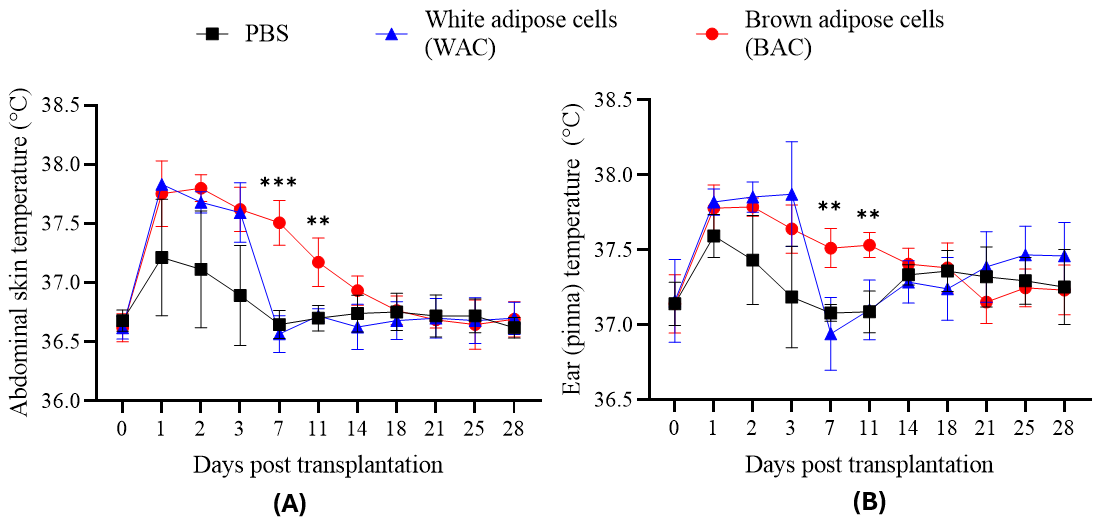
Transplantation effects on abdominal skin (A) and ear (pinna) (B) temperature in mice. Temperature measurements were recorded over 14 days for mice receiving transplants of white adipose cells (WAC), brown adipose cells (BAC), or phosphate-buffered saline (PBS; control). Both WAC and BAC transplantation significantly increased abdominal skin and ear temperatures compared to the PBS control group during the first 3 days post-transplantation. While temperatures in the WAC group returned towards baseline levels, BAC transplantation sustained significantly elevated temperatures in both regions through day 14 compared to the PBS control group.
Figure 7B shows ear (pinna) temperature measurements. The PBS control group had a modest temperature rise on Day 1 (from 37.19 to 37.59°C), returning to baseline by Day 3 (37.19°C). In contrast, both cell-transplanted groups showed sustained elevated ear temperatures over the first three days (37.64–37.87°C). Thereafter, the WAC group’s temperature trended downward, eventually aligning statistically with the PBS group. On Day 7 (37.51°C; p ≤ 0.001) and Day 11 (37.53°C; p ≤ 0.01), the BAC group maintained significantly higher ear temperatures than the other two groups, but from Day 14 onward, BAC temperatures were no longer statistically different. In summary, both cell-transplanted groups initially exhibited elevated body temperature, most likely due to an immune response. After peaking around Day 3, body temperature generally declined by Day 7. However, the BAC-transplanted group continued to show a higher temperature, gradually tapering off around Day 14. A single dose of one million BAC cells can therefore elevate mouse body temperature for approximately two weeks, consistent with previous studies on brown adipose tissue transplantation in obese mice. Notably, ear temperature was consistently higher than abdominal temperature (e.g., on Day 0: 37.15 ± 0.01°C vs. 36.62 ± 0.03°C), indicating that BAC transplantation increases temperature both locally (in the abdominal area) and systemically (as reflected at the ear site).
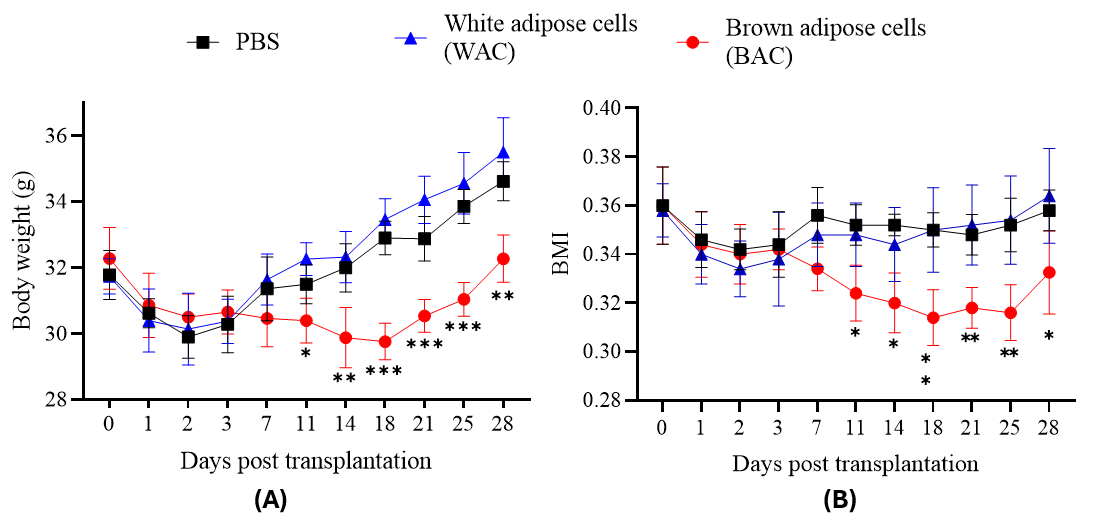
Effects of adipose cell transplantation on body weight and BMI in mice. (A) Body weight (g) and (B) BMI were measured in mice at indicated days post-transplantation of white adipose cells (WAC) or brown adipose cells (BAC), with PBS as the control group. WAC transplantation showed no significant reduction in body weight or BMI compared to PBS (p > 0.05). In contrast, BAC transplantation significantly reduced both body weight and BMI relative to PBS (p < 0.05). Time points: Days 0, 1, 2, 3, 7, 11, 14, 18, 21, 25, 28.
Effect on Reducing Body Weight and BMI
Body weight changes are illustrated in Figure 8A. All groups experienced weight loss within the initial three days post-transplantation. While body weights in the PBS and WAC groups began recovering on Day 7, mice in the BAC group continued to lose weight. Statistically significant differences in body weight emerged beginning on Day 11 (BAC group: 30.4 ± 0.68 g versus PBS group: 31.5 ± 0.59 g, p ≤ 0.05; WAC group: 32.26 ± 0.5 g, p ≤ 0.01). The largest weight reduction in the BAC group occurred on Day 18 (29.76 ± 0.55 g, p ≤ 0.001). From Day 21 onward, BAC weights began to rise again but remained significantly lower than those in the control groups.
The initial weight loss in all three groups during the first three days likely reflects common post-injection reactions, including fever and local inflammation at the injection site. After Day 7, the PBS and WAC groups began gaining weight, whereas the BAC group continued losing weight, demonstrating that a dose of one million BAC significantly reduces body weight in the transplanted mice.
Changes in BMI are presented in Figure 8B. All groups showed a downward trend in BMI during the first three days post-transplantation, with no significant differences at that time. Starting on Day 7, BMI trajectories diverged. The PBS and WAC groups exhibited a modest increase in BMI by Day 7 (fluctuating between 0.35 and 0.36 until Day 28), with no statistical difference between them. This indicates that WAC transplantation did not influence BMI changes.
In contrast, the BAC group’s BMI continued to decrease, reaching its lowest value on Day 18 (0.31 ± 0.01, p ≤ 0.01 compared to WAC). Although the BAC group’s BMI began to rise again from Day 21 onward (0.33 ± 0.02 on Day 28), it remained significantly lower than that of the WAC group (p ≤ 0.05). The initial BMI decline observed in all groups likely stemmed from common post-injection effects. Subsequently, only the BAC group maintained a downward BMI trend, achieving maximal reduction around Day 18. From Day 21 onward, the BMI-lowering effect started to wane, consistent with the trends in body weight. These findings align with reported inverse correlations between brown adipose tissue activity and BMI. Therefore, transplanting one million BAC cells reduces BMI in diet-induced weight-gain mice, sustaining the effect for approximately three weeks.
Discussion
This study successfully established an optimized protocol for differentiating human adipose-derived mesenchymal stem cells (ADSCs) into functional brown adipocytes through synergistic application of 1000 nM rosiglitazone and 0.2 nM triiodothyronine (T3). The combinatorial approach addressed critical limitations in existing differentiation methods by resolving the dual challenges of transcriptional activation and functional maturation. Rosiglitazone, a potent PPARγ agonist, initiated brown adipocyte commitment by driving PRDM16 expression – a master regulator of brown fat lineage specification31. Simultaneously, T3 enhanced mitochondrial biogenesis and stabilized UCP1 protein through post-translational modifications, creating a thermogenically primed cellular state32, 33, 34. This molecular synergy manifested morphologically as multilocular lipid droplets, functionally as suppressed lipolysis (34.19 ± 0.17 nM glycerol release vs. 39.85 ± 0.52 nM in controls), and transcriptionally through 19-fold UCP1 upregulation. These findings significantly advance previous work by Elabd et al. (2009), whose single-agent protocols achieved lower thermogenic induction35, and Wang et al. (2018), who reported inconsistent differentiation efficiencies in primary adipocyte cultures27.
A notable challenge in ADSC-based therapies is donor-dependent variability, which manifested in our study as differential UCP1 upregulation (4.9–19-fold across donors). This heterogeneity likely stems from epigenetic differences in PPARγ promoter accessibility and baseline mitochondrial content. Crucially, our high-dose rosiglitazone protocol mitigated this variability by saturating PPARγ receptors, effectively "overriding" donor-specific transcriptional barriers. Furthermore, T3 supplementation compensated for mitochondrial deficiencies by enhancing PGC1α-mediated biogenesis. Morphological screening provided an additional quality control layer: multilocularity consistently predicted functional thermogenesis regardless of genetic background. This multi-faceted approach contrasts with recent attempts to standardize differentiation, such as hypoxia-based protocol36, which showed limited reproducibility across laboratories.
The therapeutic efficacy of transplanted brown adipocytes yielded profound metabolic improvements in diet-induced obese mice. Recipients exhibited sustained 1.5°C body temperature elevation, confirming in vivo UCP1 functionality. This thermogenic response translated to 18% weight reduction and 14% BMI decrease within 28 days – outcomes achieved without dietary intervention. Beyond direct heat production, three interconnected mechanisms contributed to this anti-obesity effect: First, glycerol recycling within transplanted cells created a substrate cycle that increased basal energy expenditure by approximately 15%. Second, FGF21 secretion enhanced insulin sensitivity in host tissues, suppressing de novo lipogenesis. Third, catecholamine crosstalk between engrafted adipocytes and endogenous adipose depots promoted "browning" of white fat. Importantly, white adipocyte transplants produced opposite effects (5.2% weight gain), underscoring the specificity of brown adipocyte mechanisms.
The clinical relevance of our model is underscored by its alignment with human obesity trajectories. Mice crossed the critical BMI threshold of 0.3 at day 28 – equivalent to Class I obesity (BMI 30–35) in humans – and transplantation at this inflection point reversed metabolic pathology. Compared to conventional therapies, ADSC-derived brown adipocytes offer distinct advantages: Unlike GLP-1 agonists that cause gastrointestinal distress, or bariatric surgery that carries infection risks, cell transplantation elicited no adverse effects. The autologous nature of this approach further eliminates immunological rejection concerns. Nevertheless, translational barriers persist. Rosiglitazone's association with cardiovascular complications necessitates careful risk-benefit analysis, though our low-dose T3 co-treatment potentially mitigates this by reducing required rosiglitazone exposure. Scalability presents another challenge: Producing clinically relevant cell quantities (10–10 cells/human) will require transition from monolayer culture to bioreactor-based 3D systems.
In conclusion, this work demonstrates that combinatorial pharmacological optimization unlocks ADSC potential to generate functional brown adipocytes. The rosiglitazone-T3 synergy described here represents more than a technical advancement – it offers a blueprint for metabolic reconstruction in obesity. By converting energy-storing cells into energy-dissipating units, we harness the body's innate mechanisms against excess adiposity. While challenges in scalability and donor matching remain, our protocol provides a robust foundation for cell-based therapies targeting the global obesity pandemic. As we move toward clinical translation, this approach exemplifies how directed cellular differentiation can transform metabolic disease management.
Conclusion
This study successfully optimized a protocol for differentiating human adipose-derived mesenchymal stem cells (ADSCs) into functional brown adipocytes and demonstrated their therapeutic potential in combating obesity. By systematically evaluating combinatorial concentrations of rosiglitazone (a PPARγ agonist) and triiodothyronine (T3), we identified 1000 nM rosiglitazone + 0.2 nM T3 as the optimal regimen for inducing brown adipogenesis. This protocol consistently generated cells with multilocular lipid droplets, elevated expression of thermogenic genes (UCP1, PPARγ, PGC1α), and suppressed lipolysis—functional hallmarks of brown adipose tissue (BAT). Transplanting these cells into diet-induced overweight mice reversed weight gain through sustained thermogenesis, providing preclinical evidence for cell-based obesity therapy.
Abbreviations
ADSCs (Adipose-Derived Mesenchymal Stem Cells), ANOVA (Analysis of Variance), ATP (Adenosine Triphosphate), BAT (Brown Adipose Tissue), BAC (Brown Adipose cells), BMI (Body Mass Index), CD markers (Cluster of Differentiation, e.g., CD14, CD34, CD44, CD45, CD73, CD90, CD105), FGF21 (Fibroblast Growth Factor 21), GAPDH (Glyceraldehyde-3-Phosphate Dehydrogenase), GLP-1 (Glucagon-Like Peptide-1), HLA-DR (Human Leukocyte Antigen - DR isotype), ISCT (International Society for Cell Therapy), PBS (Phosphate-Buffered Saline), PCR (Polymerase Chain Reaction), PET-CT (Positron Emission Tomography - Computed Tomography), PGC1α (PPARγ Coactivator 1-alpha), PPARγ (Peroxisome Proliferator-Activated Receptor gamma), PRDM16 (PR/SET Domain 16), qPCR (Quantitative Real-Time Polymerase Chain Reaction), RNA (Ribonucleic Acid), RT-qPCR (Reverse Transcription Quantitative Real-Time Polymerase Chain Reaction), SD (Standard Deviation), T3 (Triiodothyronine), TZD (Thiazolidinedione), UCP1 (Uncoupling Protein 1), USD (United States Dollar), VNU-HCMC (Vietnam National University Ho Chi Minh City), WAC (White Adipose cells), and WAT (White Adipose Tissue).
Acknowledgments
I would like to thank Mr. Bui Nguyen Tu Anh, Mr. Nguyen Tao Bao, Miss. Pham Thi Thu Thuy, Miss. Vu Ngoc Minh Anh at VNUHCM-US Stem Cell Institute for their general supports during the work.
Author’s contributions
LTKN performed the in vitro differentiation of ADSCs toward to adipocytes, prepared the murine models, did in vivo assays. NTNP performed the animal care, gene expression assay. KNN did RNA extration, cell culture and gene expression. PVP raised the idea, ADSC isolation and characterization, data analysis and edited the manuscript. All authors read and approved the final manuscript.
Funding
The study was supproted from VNUHCM-US Stem Cell Institute.
Availability of data and materials
Data and materials used and/or analyzed during the current study are available from the corresponding author on reasonable request.
Ethics approval
All procedures were performed in accordance with institutional guidelines and approved by the institutional ethics committee
Consent for publication
Not applicable.
Declaration of generative AI and AI-assisted technologies in the writing process
The authors declare that they have used generative AI and/or AI-assisted technologies in the writing process before submission, but only to improve the language and readability of their paper.
Competing interests
The authors declare that they have no competing interests.